Here is selection of software I have written that covers web technologies such as node, react, php, and webaudio as well as software written in nim, ruby, openGL, and faust.
Software
Software: Upcoming
Chordite (2023-present)
nim, faust
For the last few years, I have been working on a new piece of composition software (currently called Chordite).
It is currently at the prototype stage.
This is not a video game.
Compose here. Produce there.
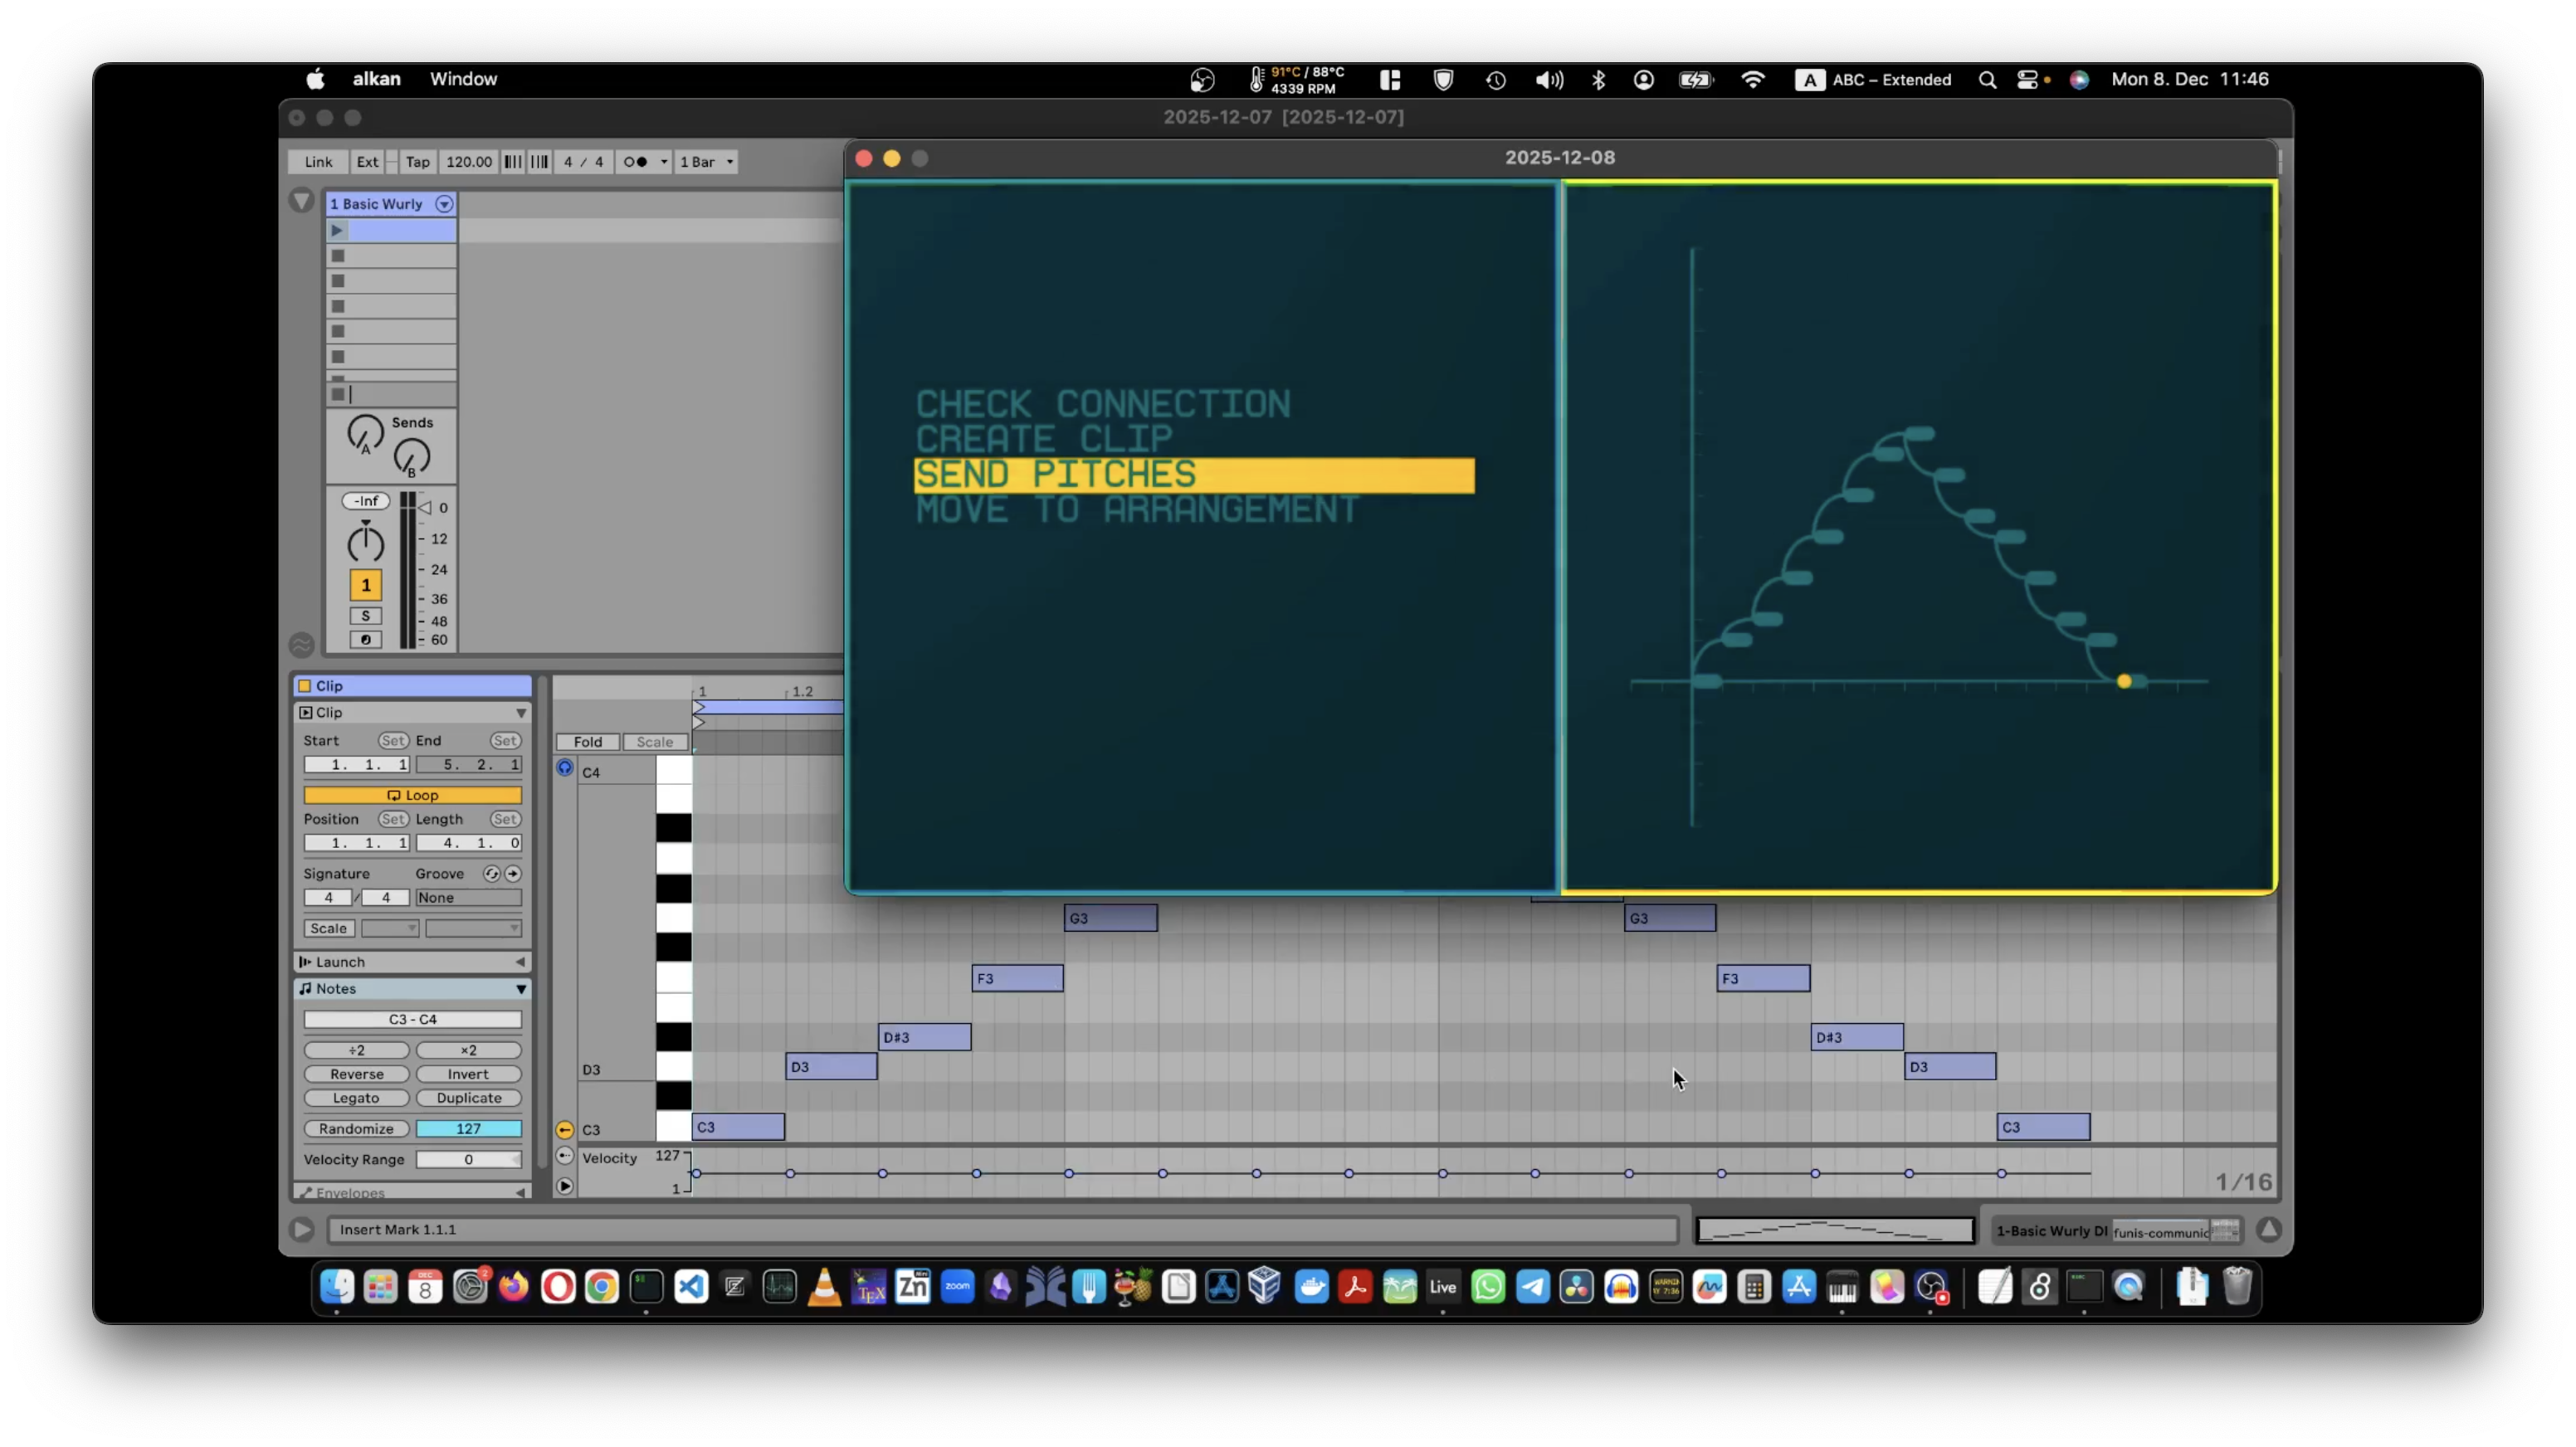
A composition-first music environment designed to live alongside your favourite music production software.
So, use Ableton, Logic, Cubase, or Reaper for sound design, mixing, and production, and use our environment for experimenting, exploring and composing.
Sketch ideas with our built-in sounds, then seamlessly hand them off to your favourite production software via OSC.
DAWs are where music gets finished. Our software is where music gets figured out.
Play here. Record there.
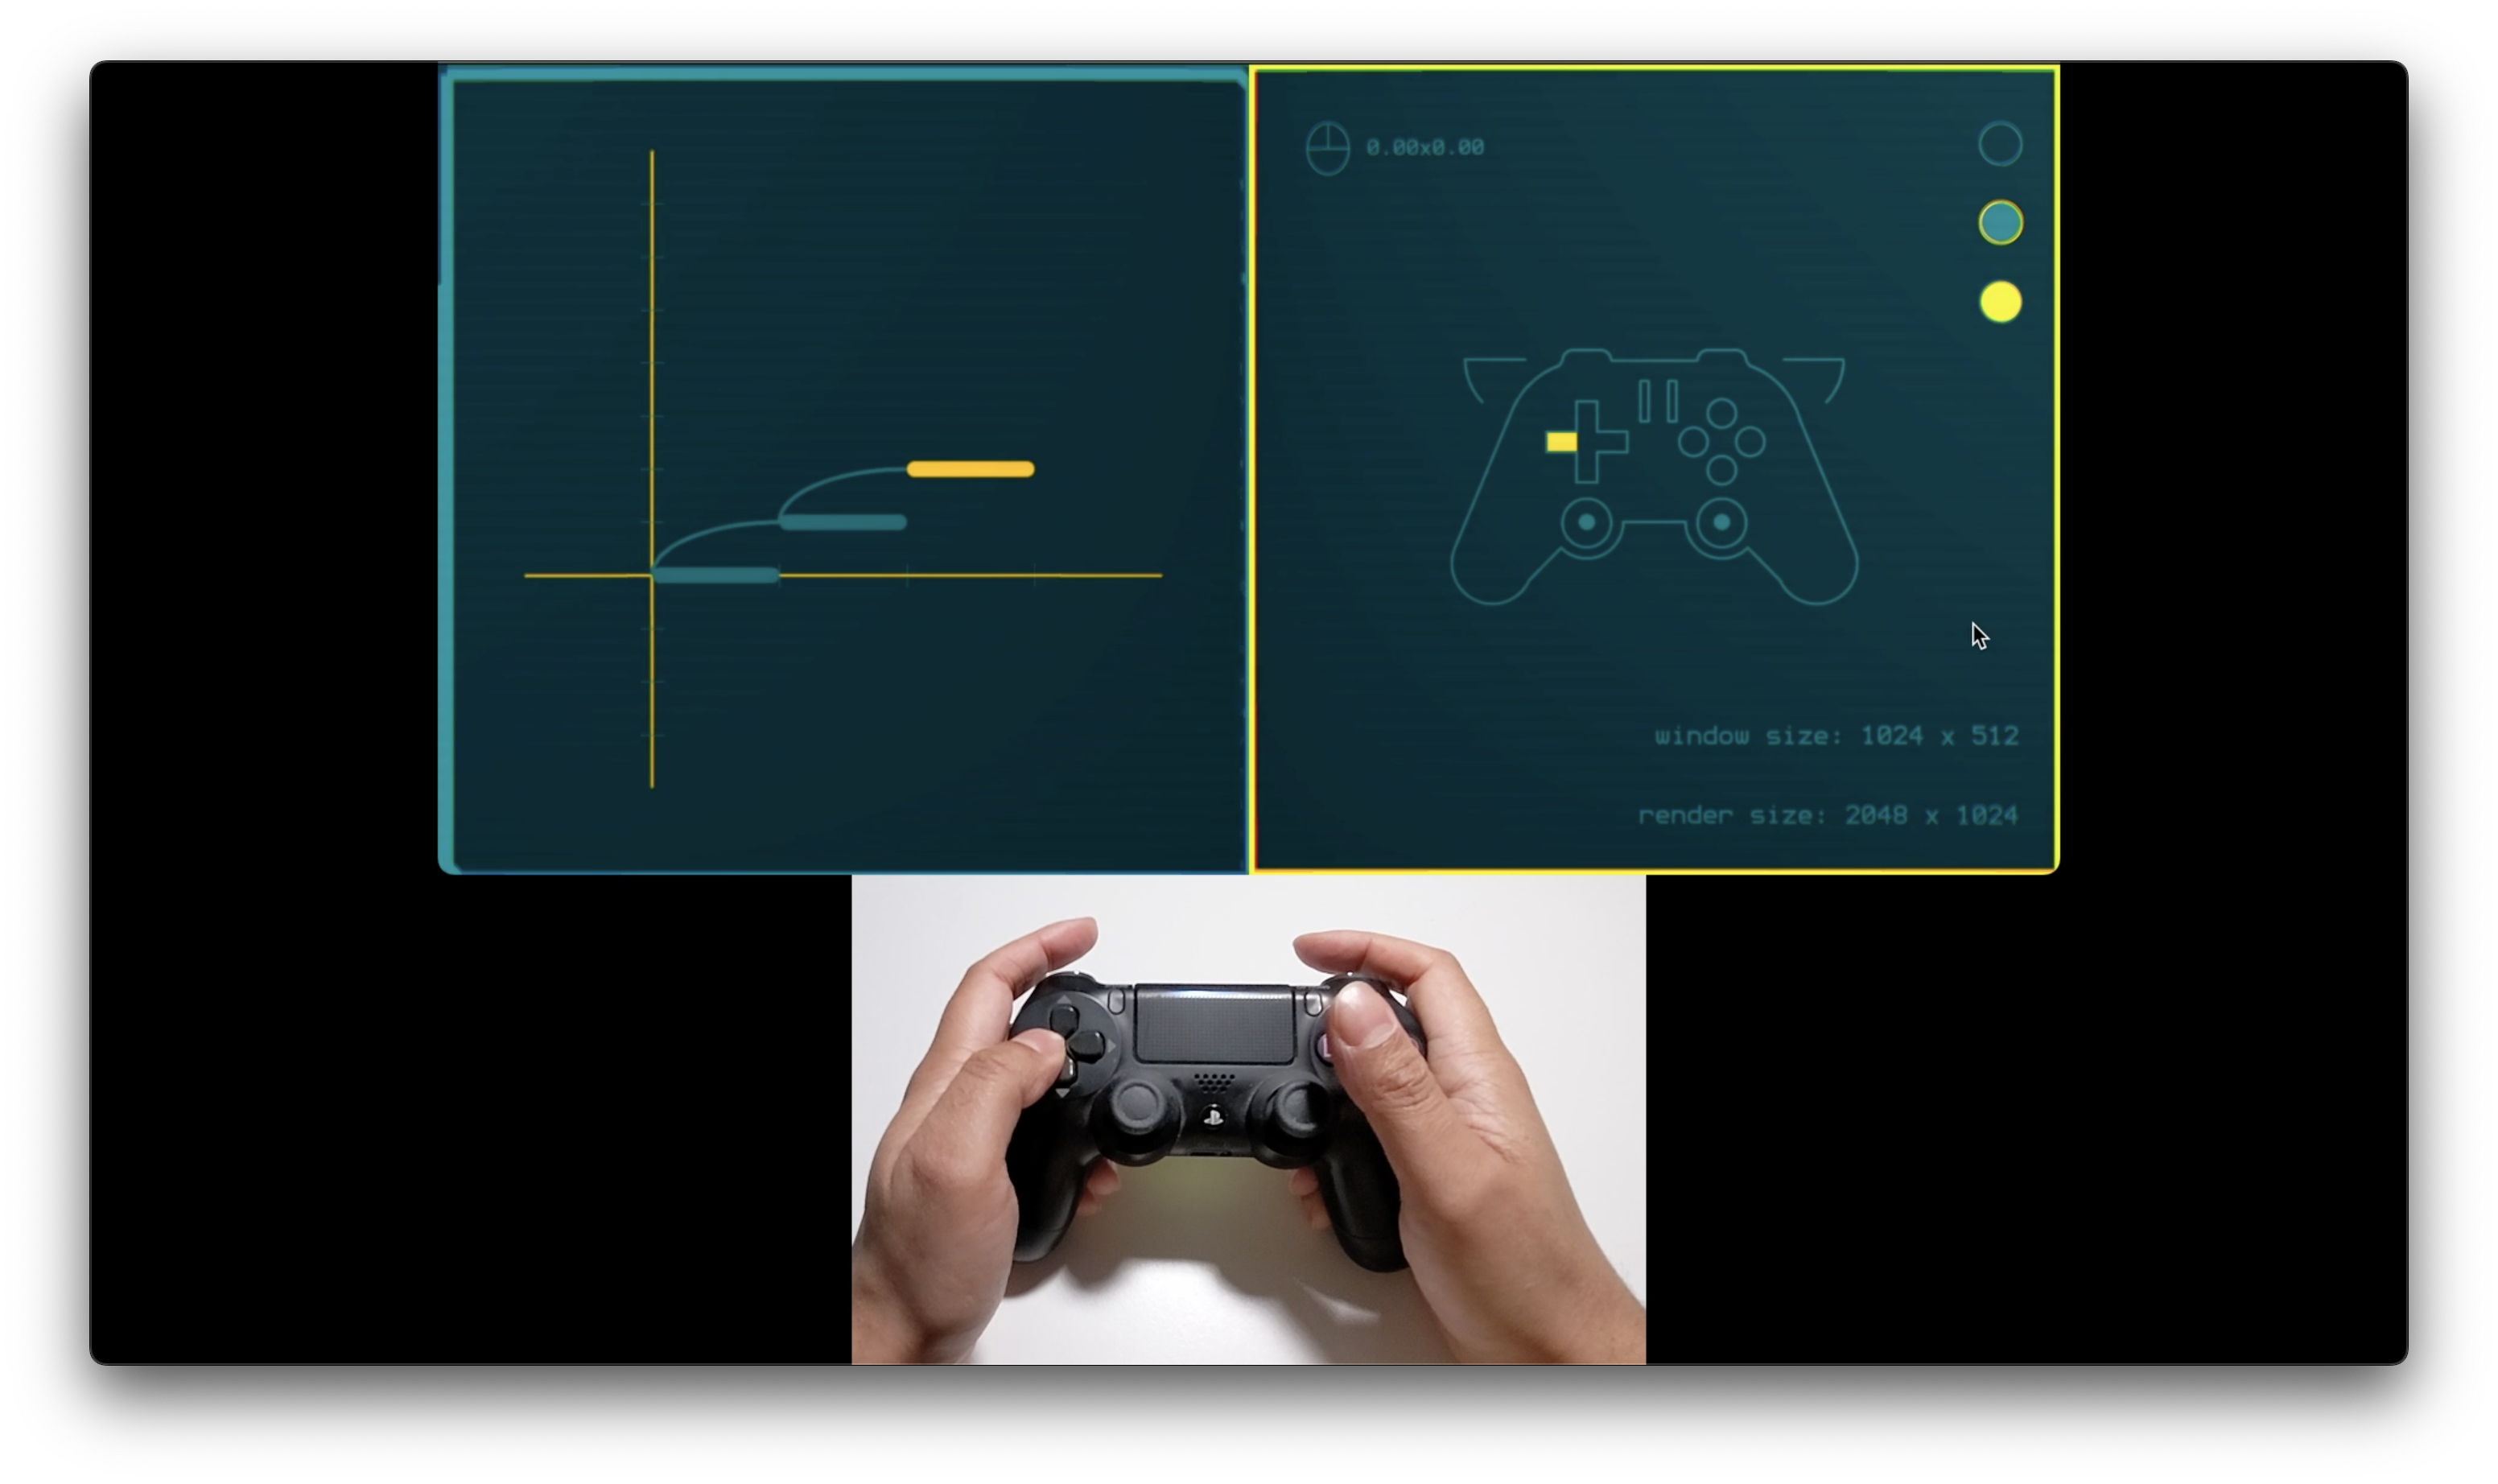
Music software doesn't have to think like a recording studio.
Nowadays, a musician is more likely to have played Minecraft than sat behind a mixing desk.
Our interface is designed for game-controllers as well as mouse and keyboard. Because interactivity should involve more than dragging tiny dials to adjust decimal values.
Eventually, this software will run on games consoles, as well as MacOS, Windows and Linux.
But this isn't a game pretending to be a tool. Or a toy.
It's serious composition software inspired by video games, because music is complex and video games are excellent at representing complex systems in understandable ways.
Explore here. Timeline there.
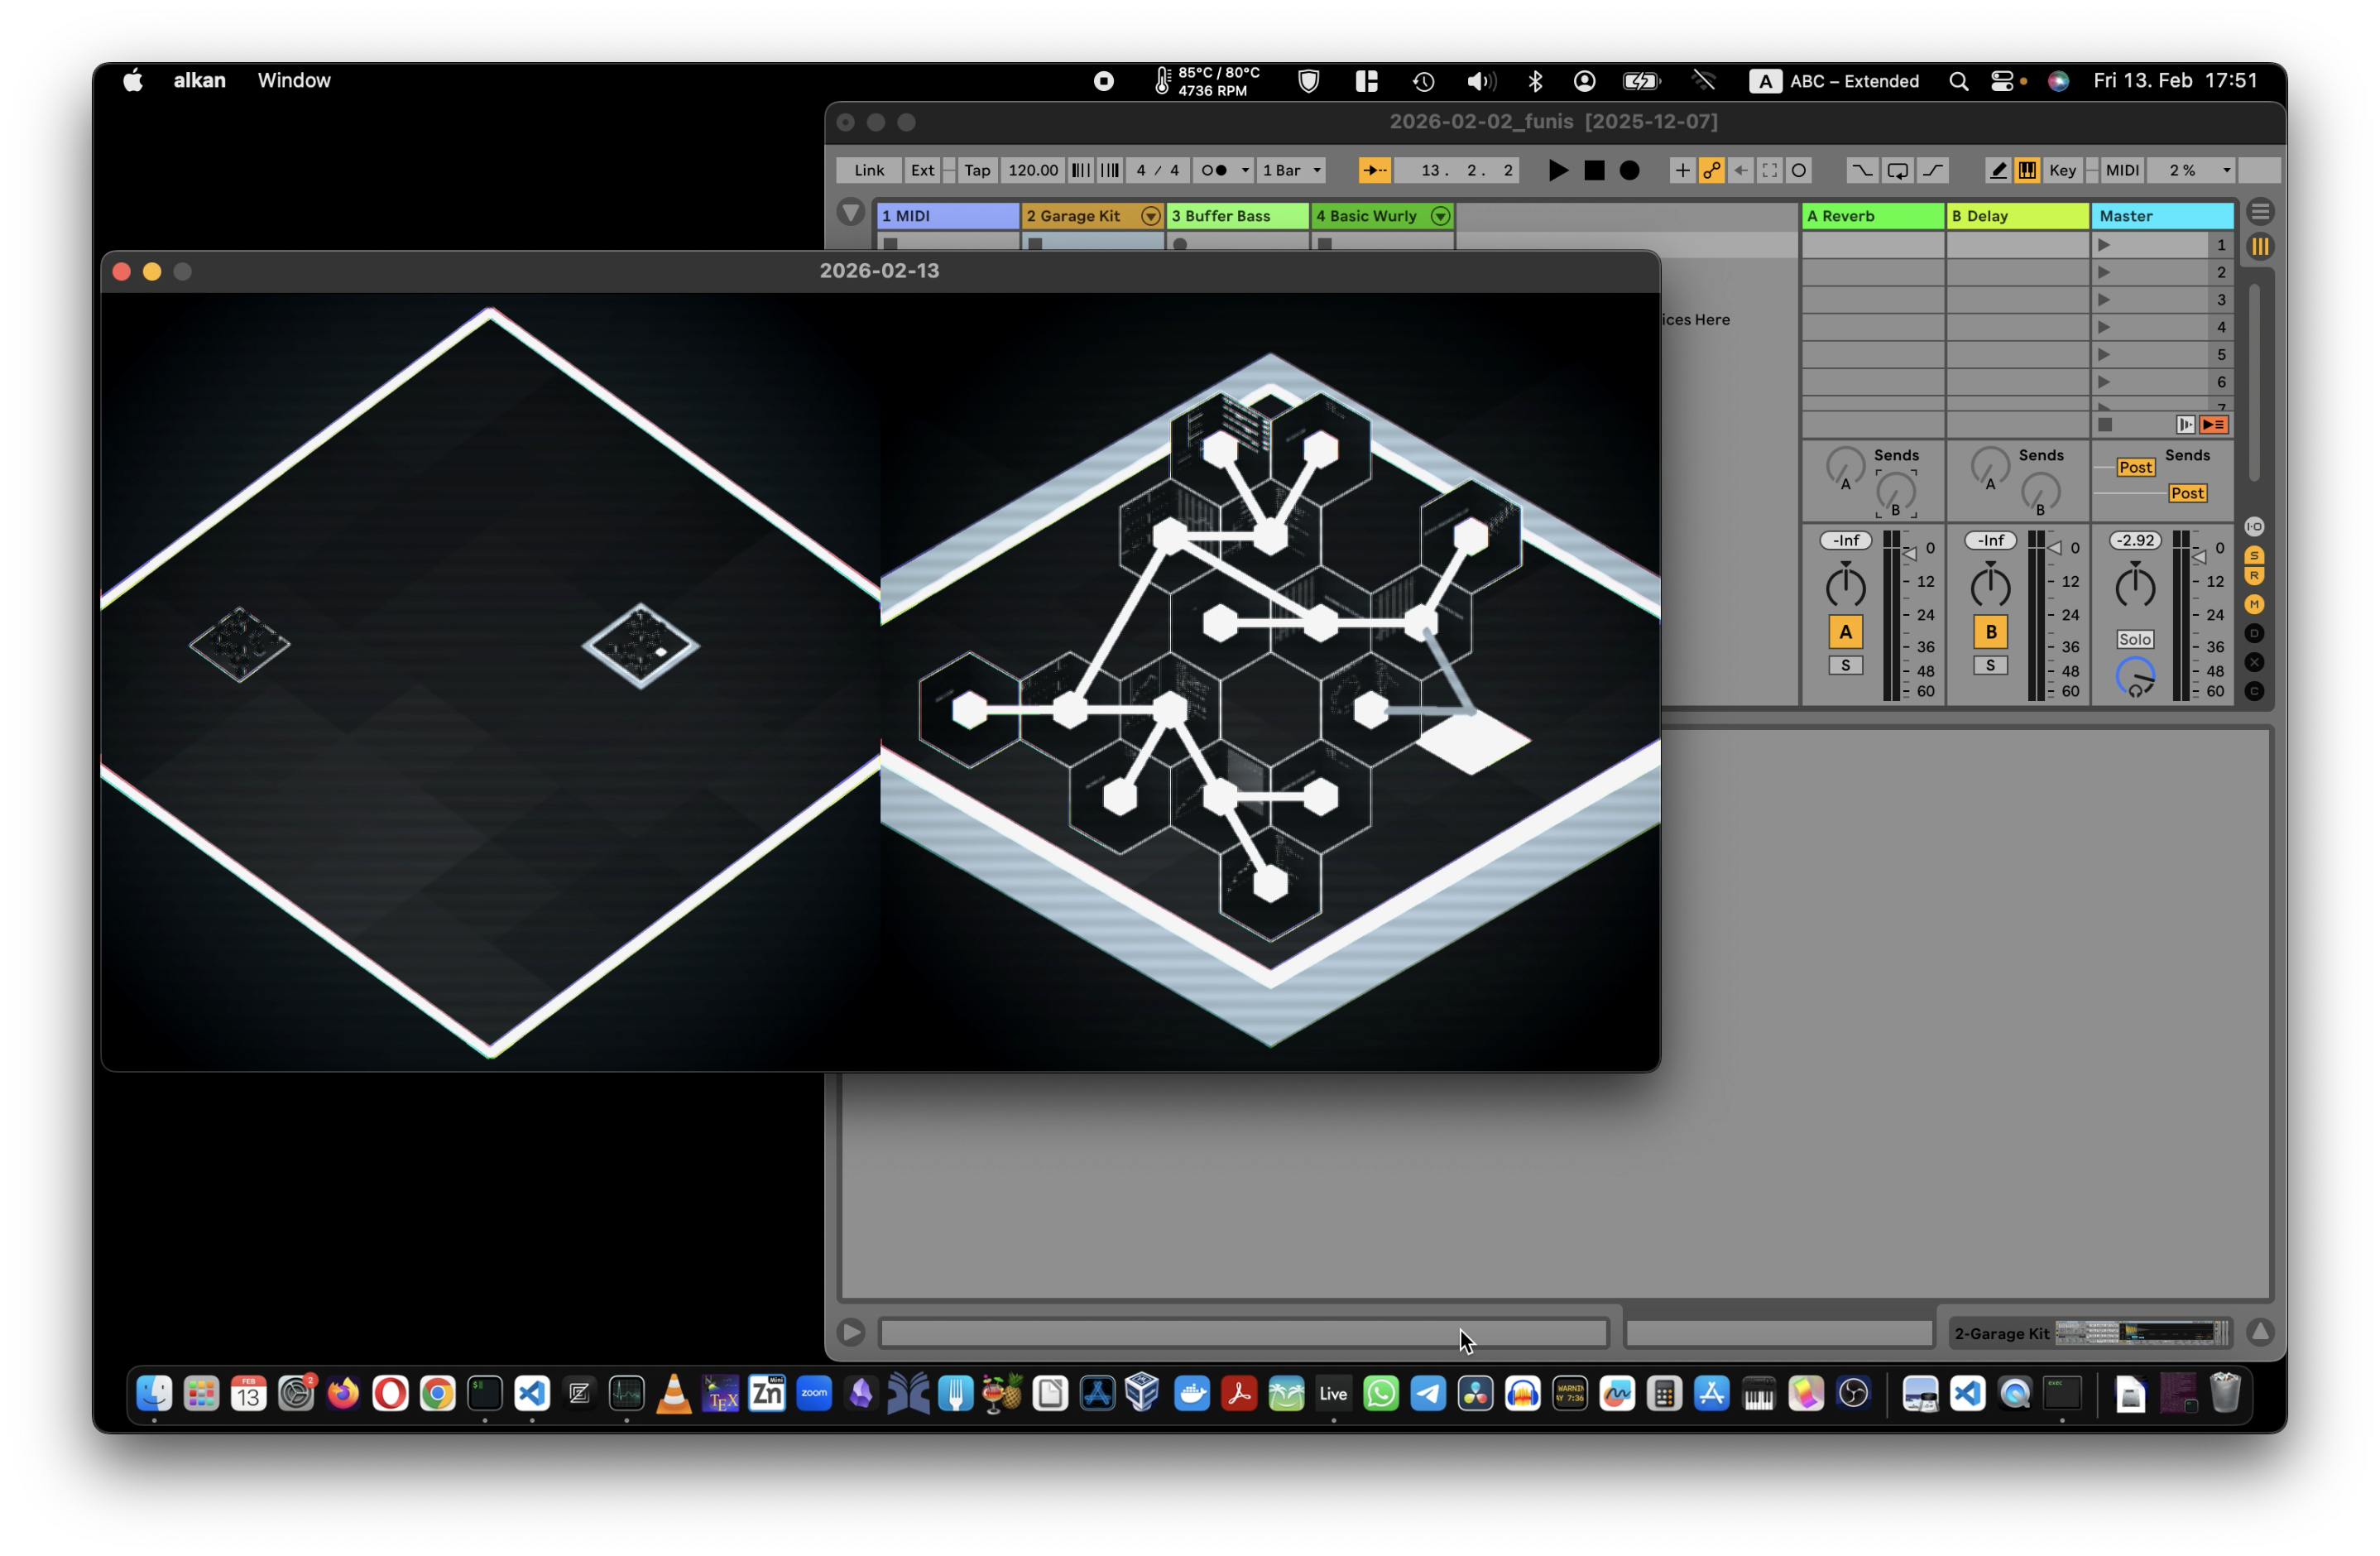
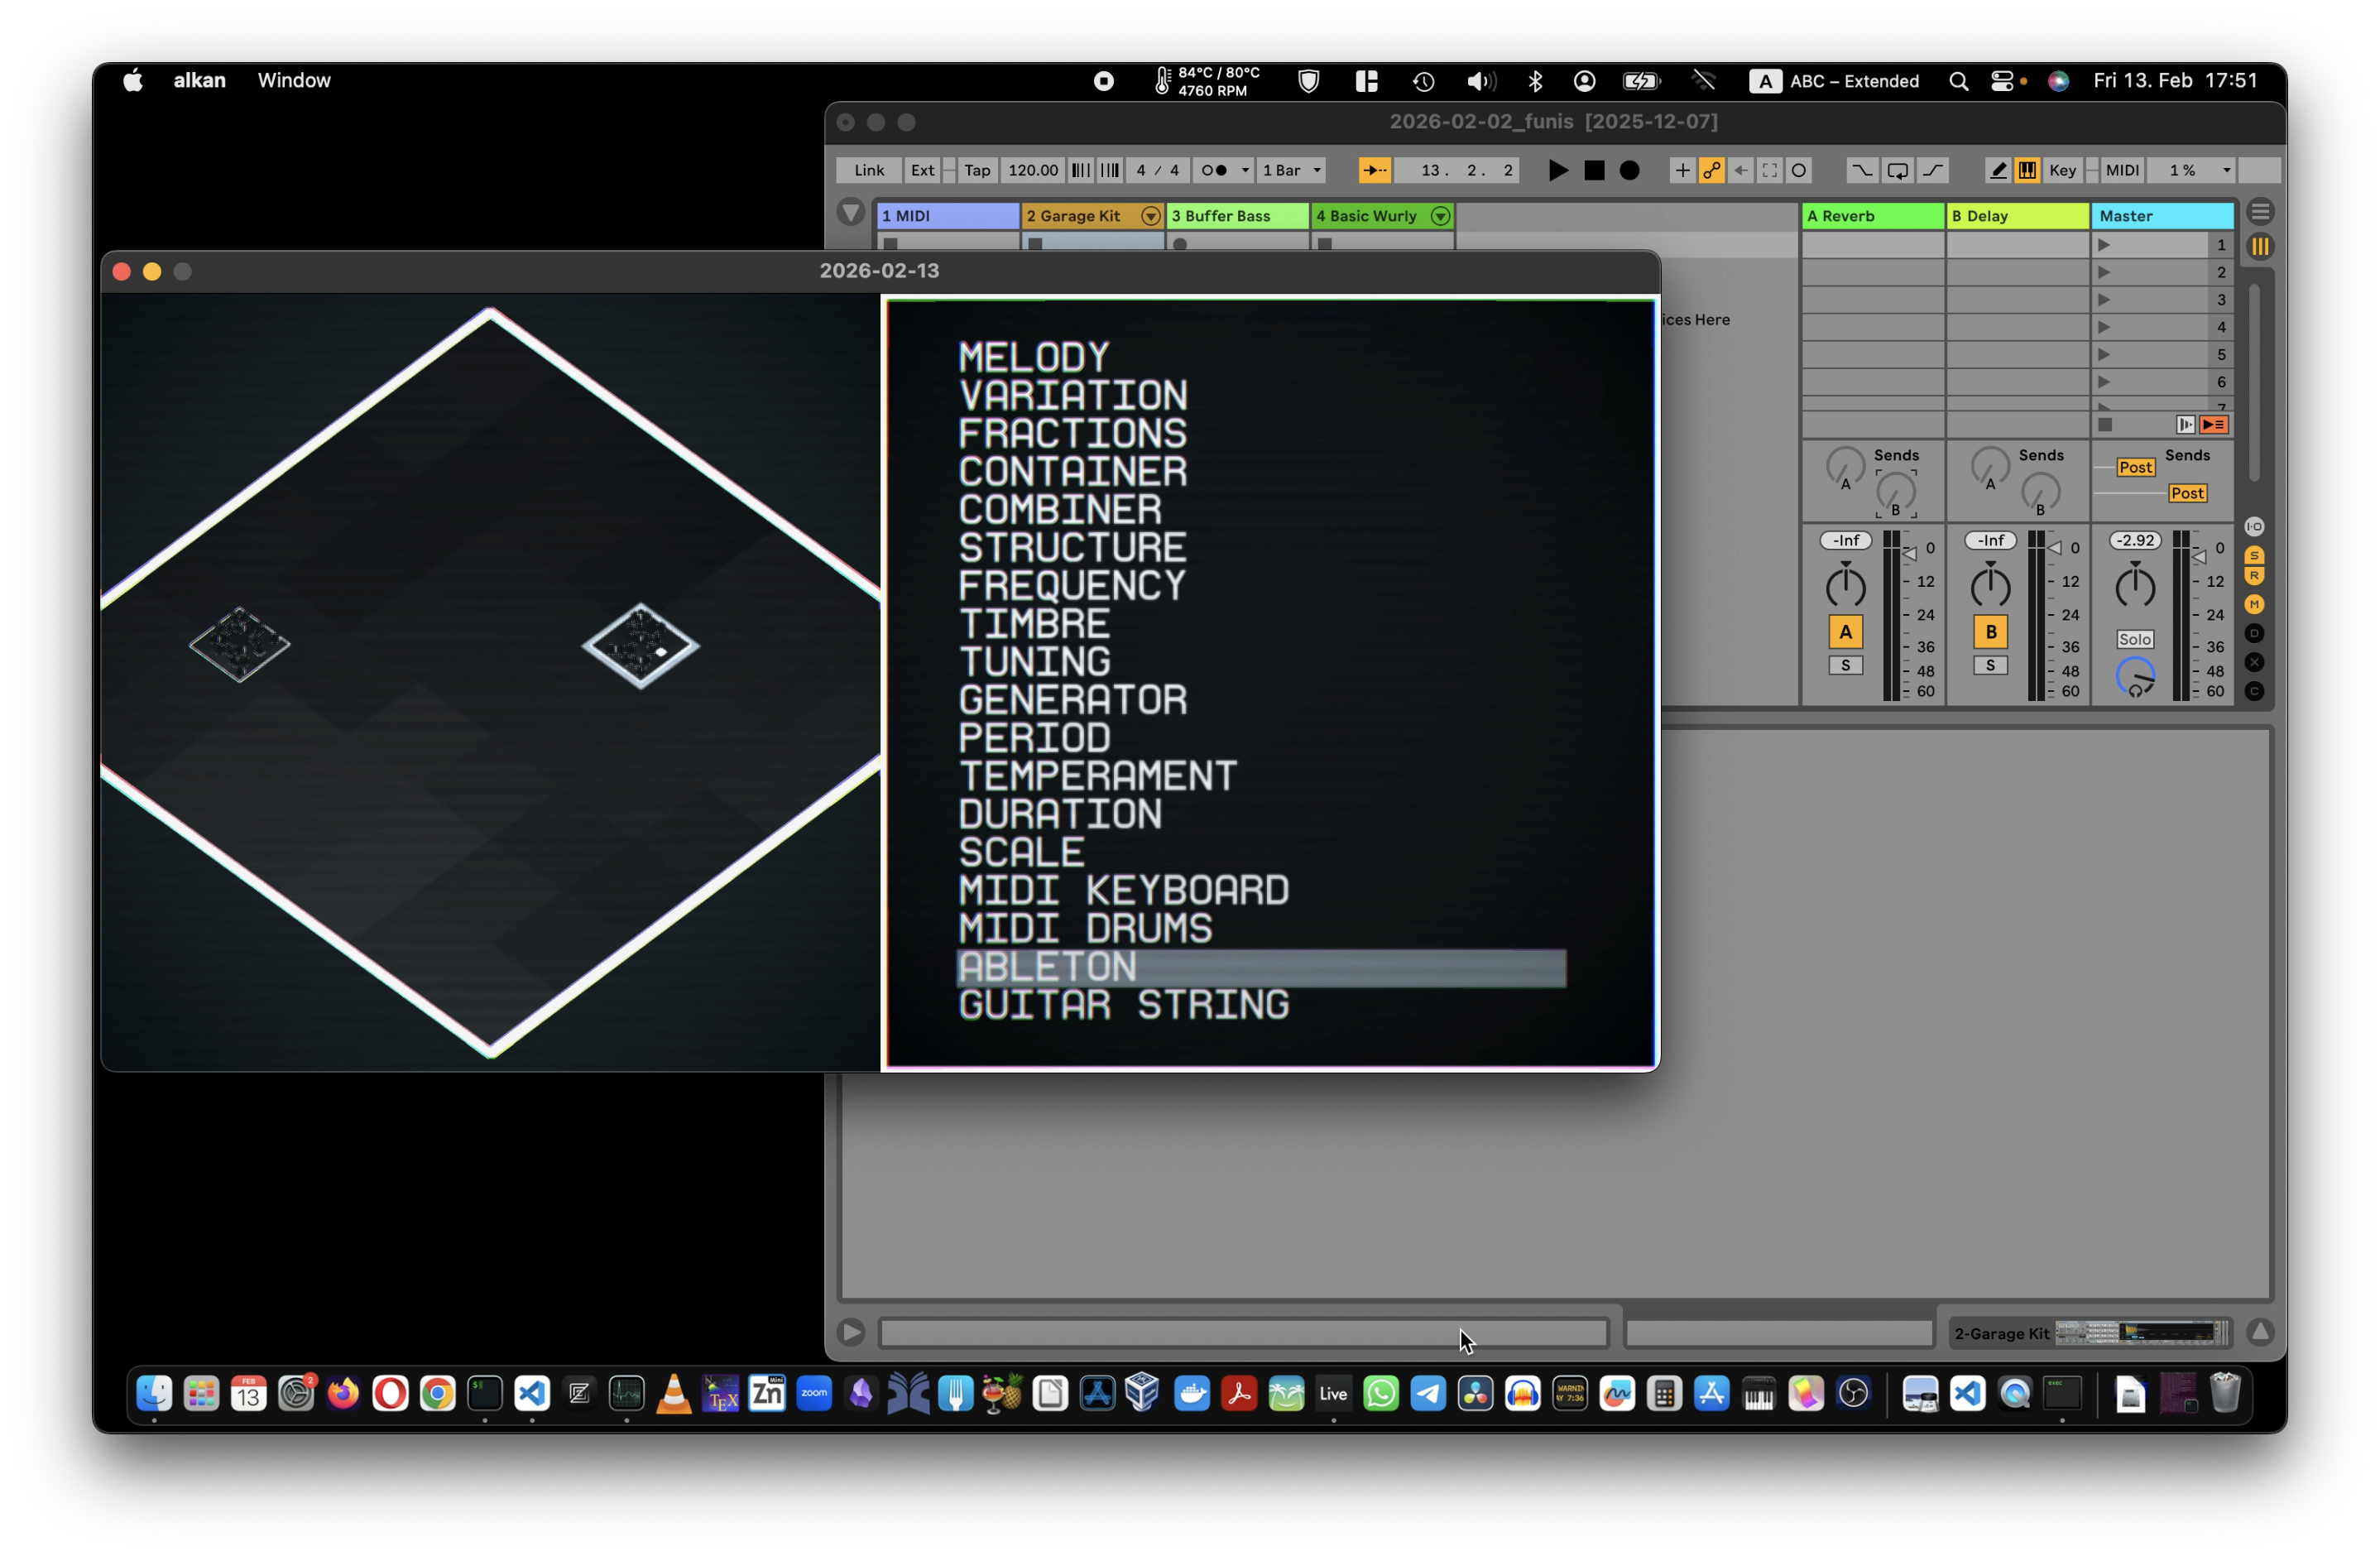
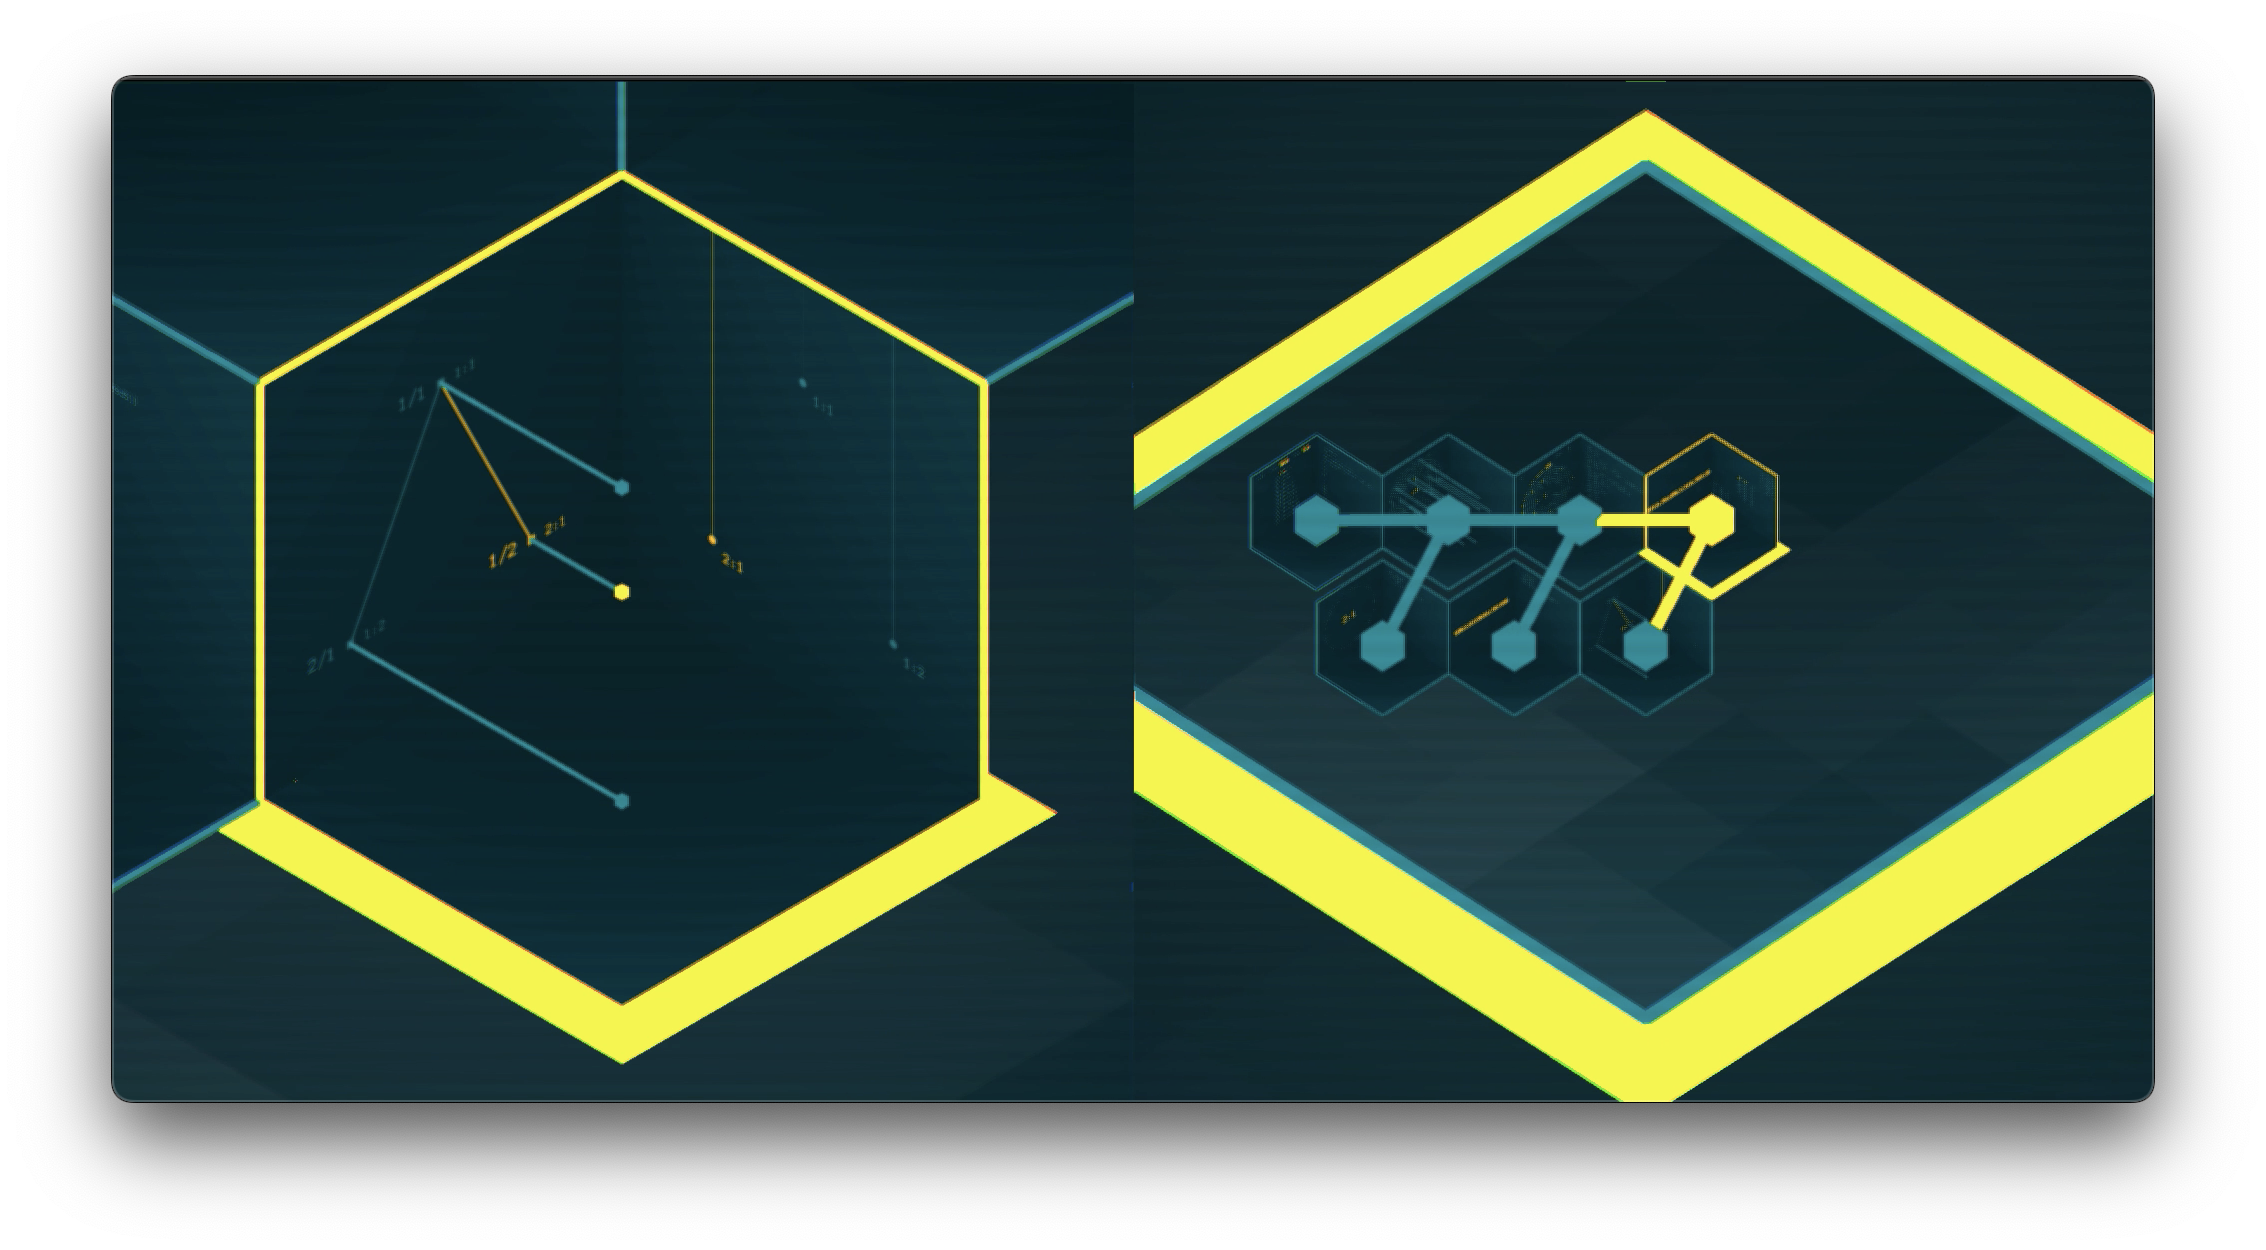
Use 3D space to help organize your thoughts, away from tracks, timelines and parameter dials.
No right-clicks. No menus buried three levels deep. Just like a video game, you learn the logic of this world through interaction, not UI clutter.
Musical objects (a melody, rhythm, tuning system etc.) are represented by boxes on a plateau. Connecting two compatible boxes together creates a new box, that can be connected to further boxes, and so on. You "craft" your music, just like a survival game.
And if you run out of room, you can inifinitely nest the 3D spaces. It's an infinite canvas, just ... different ...
Conceptualize here. Tweak there.
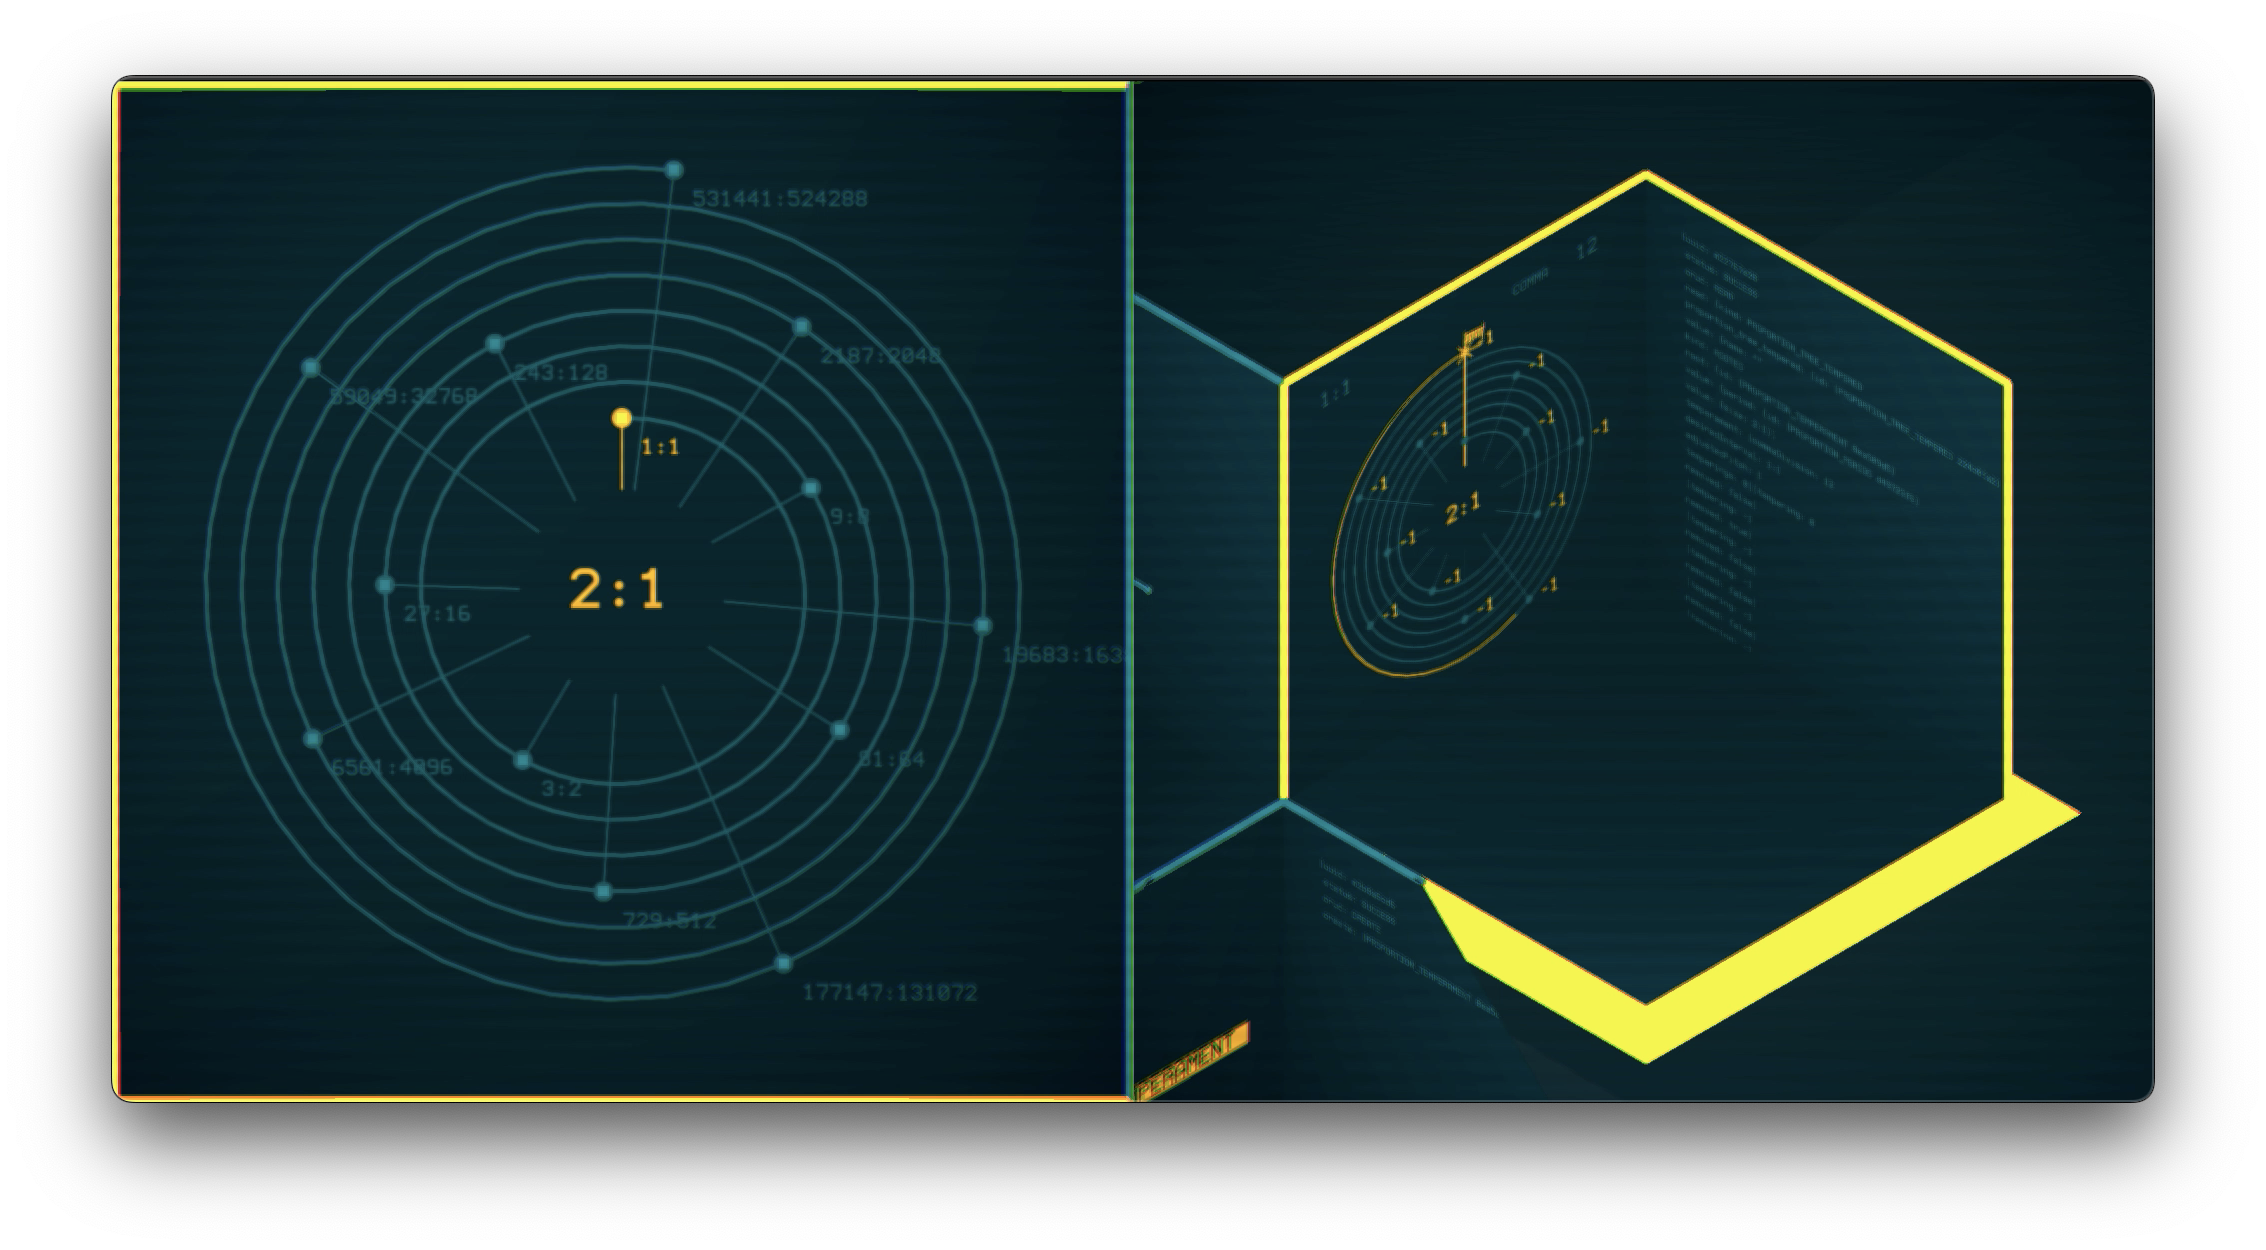
The brain of the software is what we call the musical representation engine, a unique and highly-sophisticated algorithm for encoding music, built from the ground up by experts to handle as many different types of music as possible.
It is specially-designed for dealing with common aspects of music-making most music software ignores, or incorrectly implements, such as: variation, form and tuning systems.
Music theories here. Defaults there.
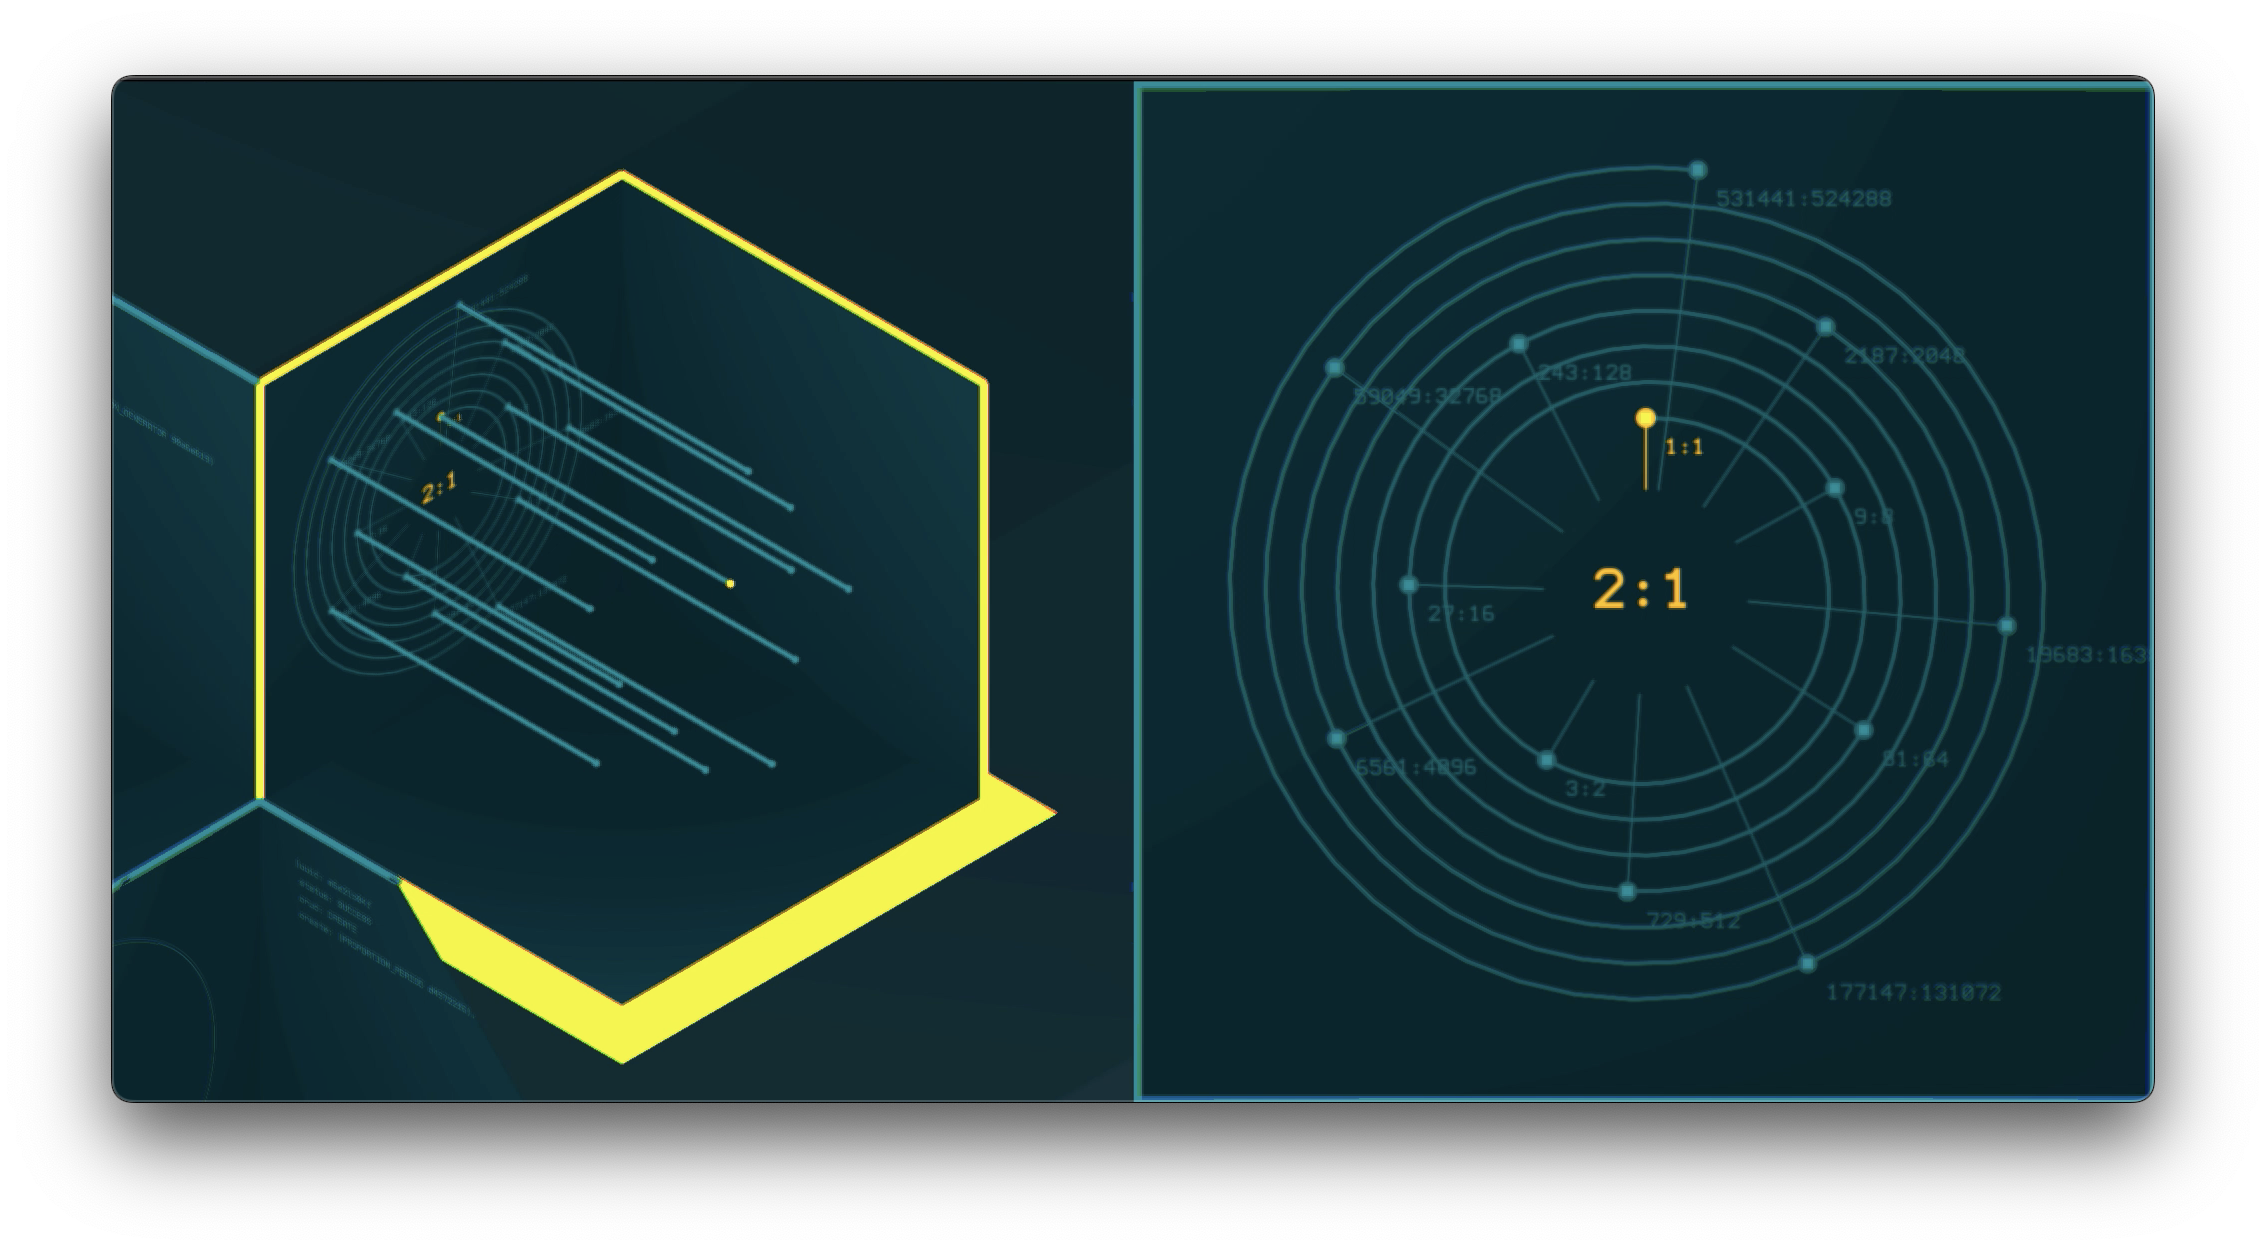
We don't think about music theory. We think about music theories.
Our software doesn't just support one way of thinking, making and dreaming about music.
Tempo. Bars. Metre. Equal temperament: These are not laws of music - they're cultural conveniences.
There is no one, single musical tradition assumed here. No default tempo. No fixed meter. No privileged tuning system.
We don't have piano rolls. We have instrument rolls.
Music software is now being used all over the world. Our software gives tools to recreate and actively interact with the rhythms, tunings and compositional ideas of many different sonic cultures, not just relegate them to an exoticized entry in a drop-down menu.
Efficiency here. Bloat there.
Software that is small, efficient, and optimized.
It is designed to be run alongside your DAW, so it does not hog resources. It is less than 20MB on disk.
As standalone software, it can run on lower-powered machines that more bloated apps would struggle on.
This efficiency makes it suitable for platforms that most music software ignores.
Architecture of UCS
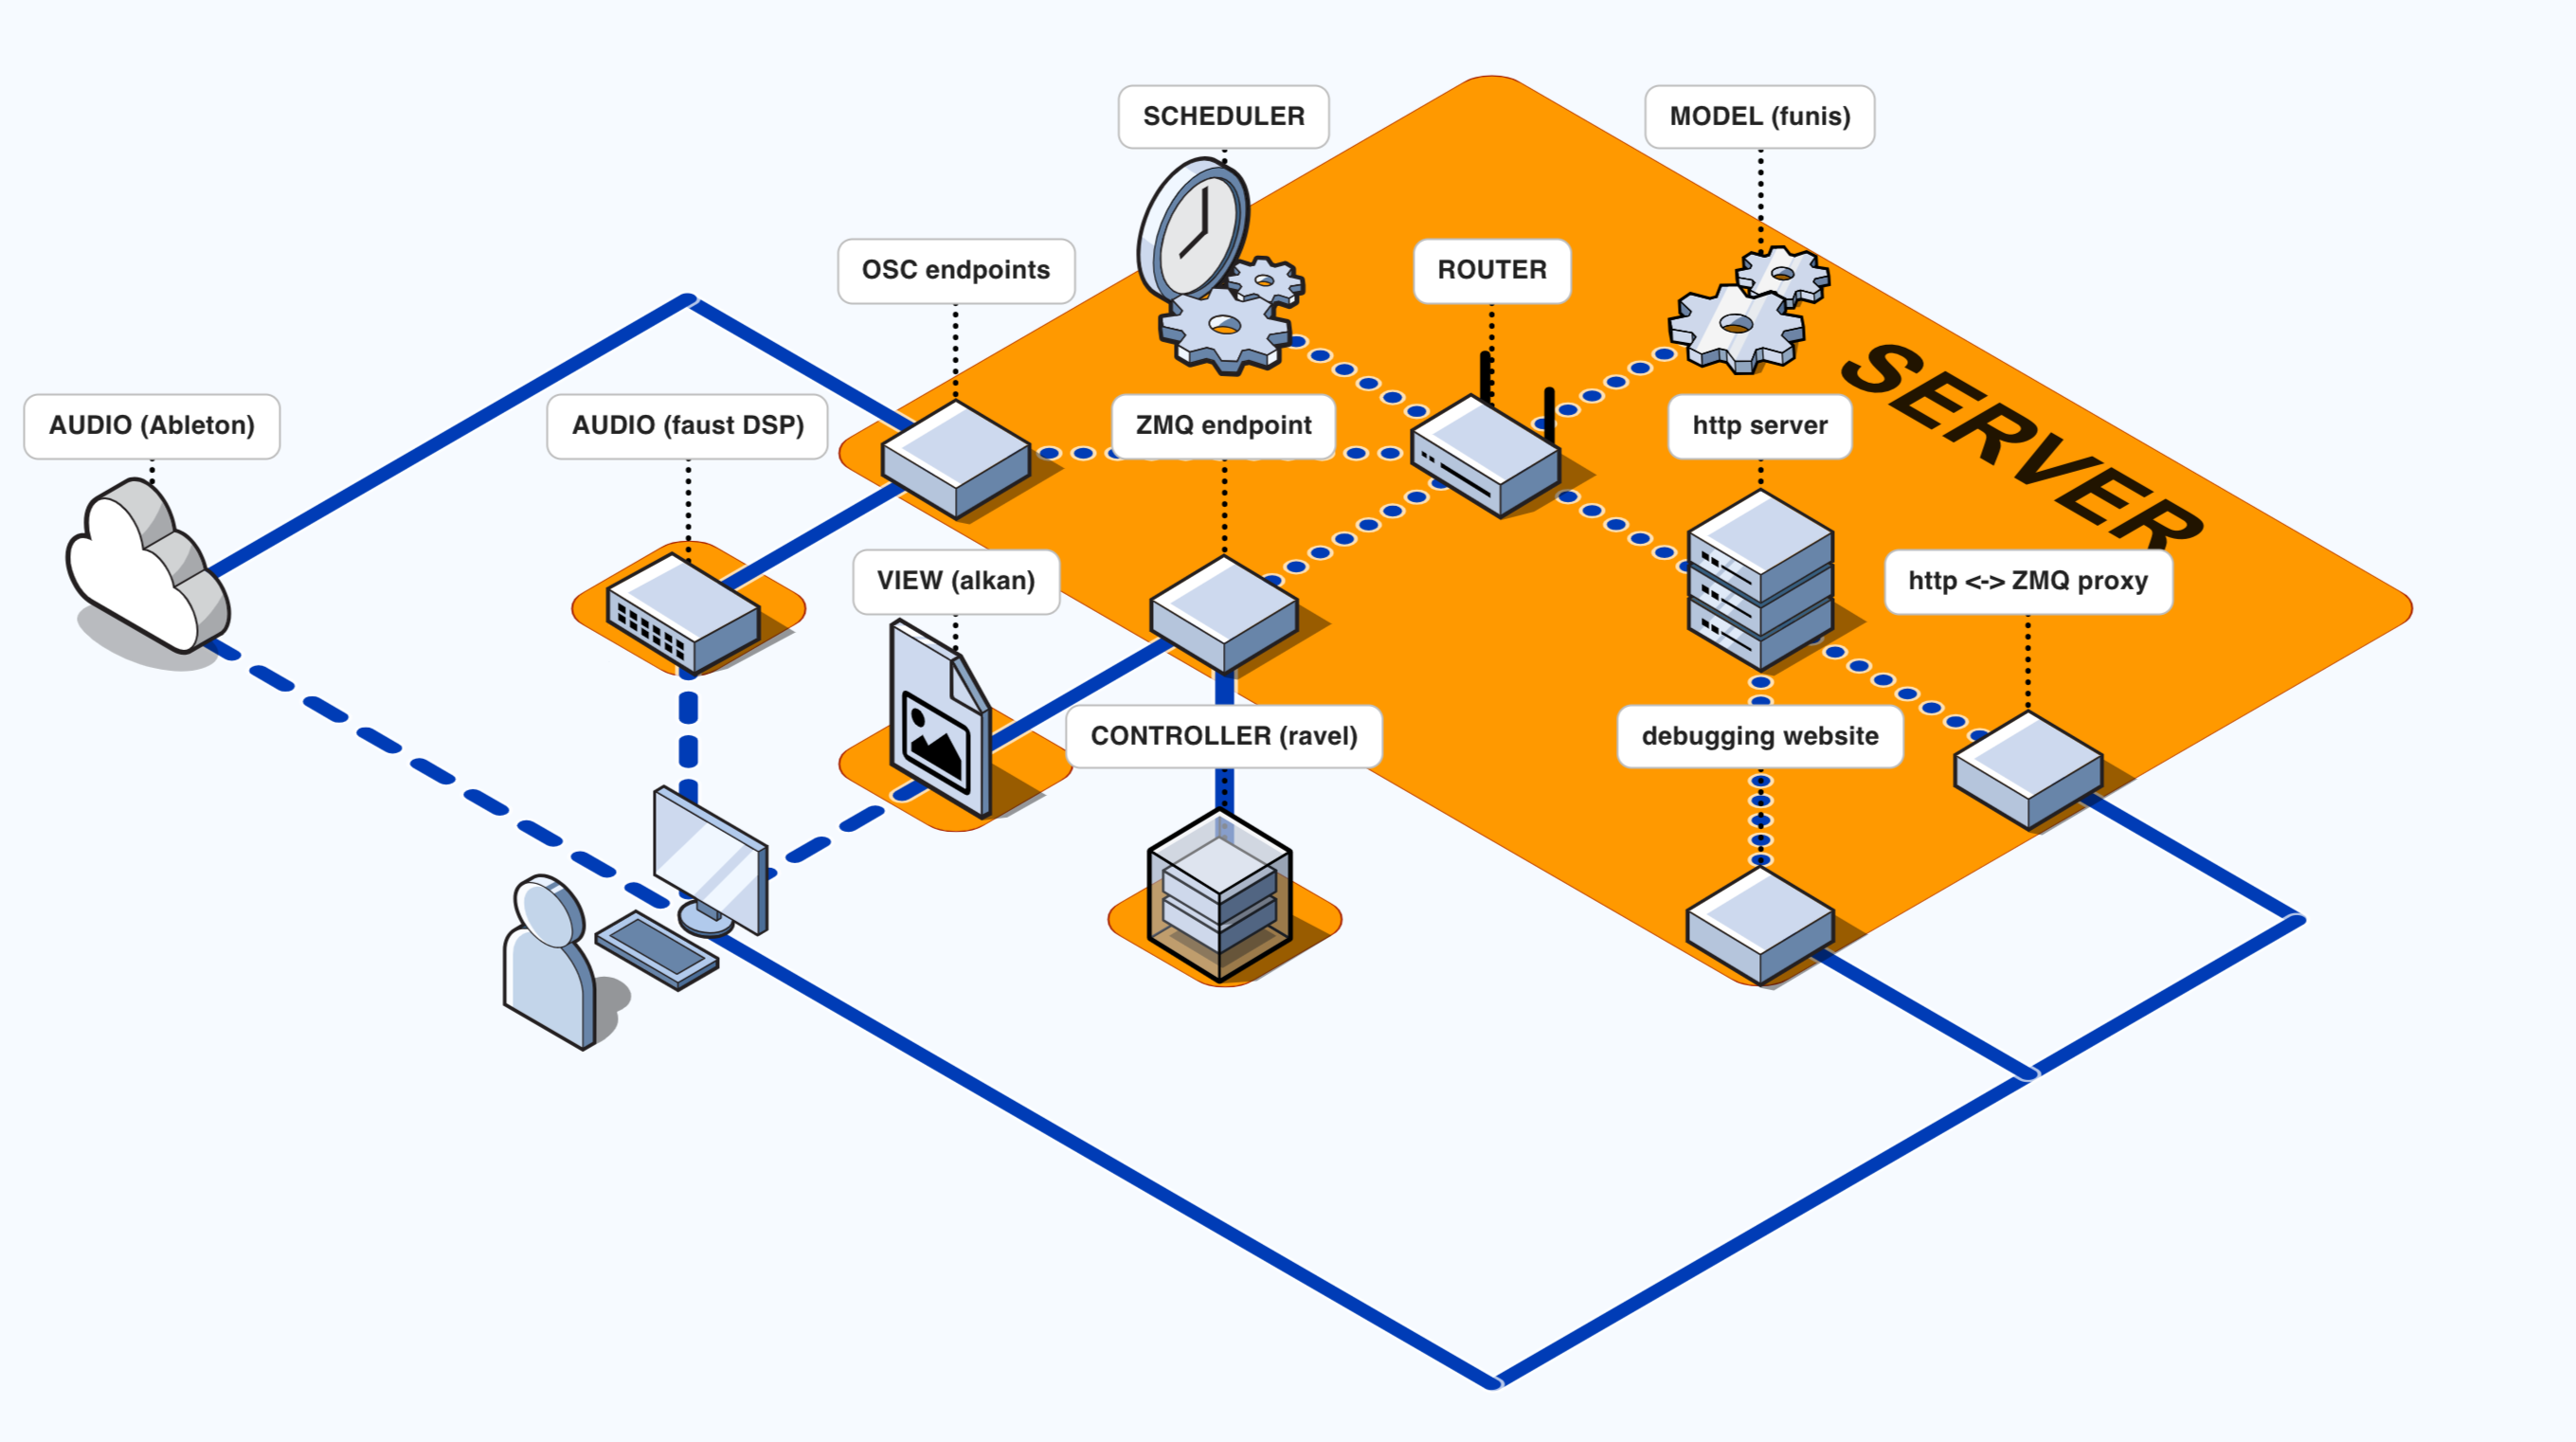
This software is a collection of smaller programs that connect together using a combination of client-server and Model-View-Controller architecture.
The servers and clients communicate over TCP, using the zero message queue library.
The main server is a small, multi-threaded program which routes all messages from all the clients, schedules Open Sound Control events and stores the model.
It also contains an http server that serves a website for debugging and viewing the contents of the model. It also provides an http endpoint for sending messages to the model an alternative way to ZMQ and TCP.
Model
The "model" deals with all of the calculation for how music is represented within the software. It is what I refer to as the musical representation engine. The model receives and sends messages in json format, using a CRUD paradigm. The model also stores a cache of any temporary calculations.
The model is stored on the main server, along with a router that receives and redirects all messages to the correct clients. It also holds a scheduler that can be used for scheduling temporal events, such as Open Sound Control that are sent to audio outputs.
Controller
The controller is a small client program that mediates between the view and model. It takes mouse, keyboard and game controller inputs from the view, makes requests and receives responses from the model, and calculates the layout of 2D and 3D objects for the view.
The layout calculation uses a reactive approach, similar to how react.js works. The layout is stored as a tree, similar to the HTML Document Object Model. The controller stores the current and previous state of the tree, then generates diffs based on the the differences. These diffs are then sent over the network to the view where they are applied to its tree, allowing the controller and view layout trees to stay in sync with each other without having to send the entire tree over the network each time it updates.
The controller also receives a message from the view on every frame, and uses this to calculate any animations.
View
The view deals with displaying things on screen and taking in inputs from the mouse, keyboard and game controller. It mixes 3D and 2D interfaces, using the raylib library for the 3D elements and the nanovg library for the 2D parts of the interface. It is written in such a way that it does not need to know anything about, nor share any code from the model - this means that it would be possible to write alternative frontends using different libraries.
Technical: Languages
This software is written mainly in the programming language nim which was chosen because of its syntax, ability to generate "native dependency-free executables, not dependent on a virtual machine, which are small and allow easy redistribution". Additionally, the clarity of the syntax, my preference for using a static type system when creating a project this large, and the C and C++ interop that allows me to use libraries written in these languages, such as raylib and nanovg.
I use the programming language faust for audio processing, as it creates similarly small, efficient standalone programs, that can connect to the main server as a client.
Libraries
I use the nanovg library for 2D rendering, raylib for 3D rendering, zmq for messaging, and faust for audio.
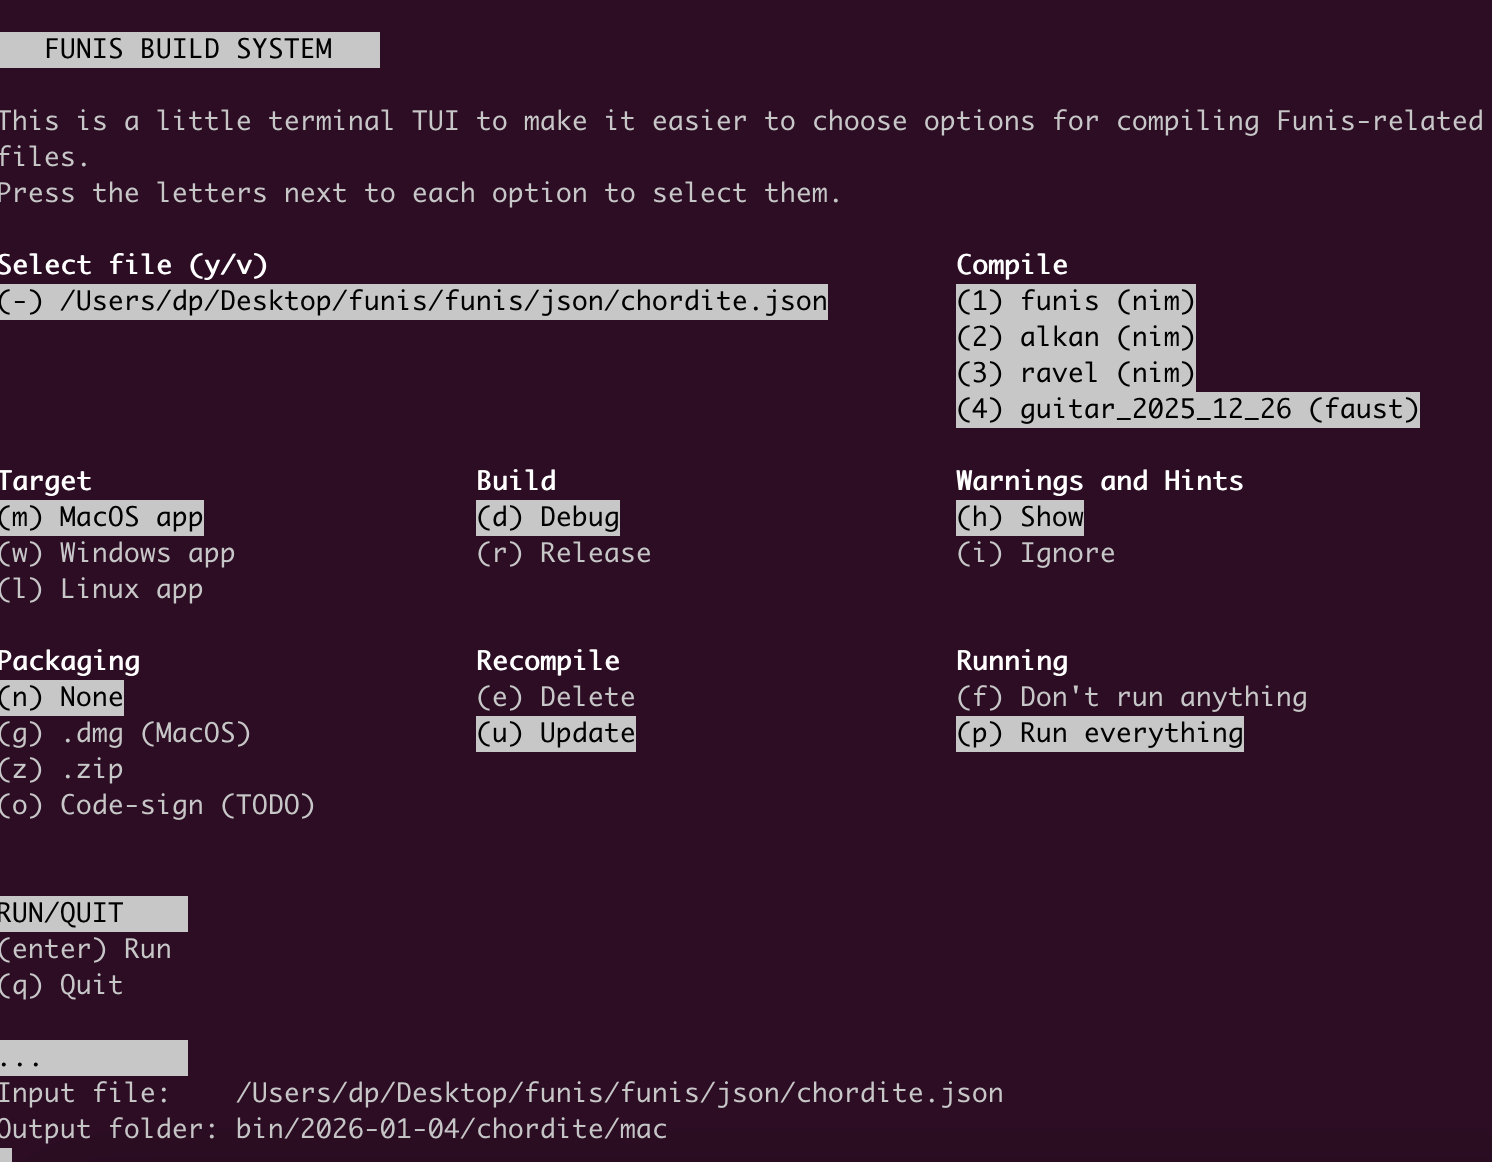
Building
There is a custom build system with a TUI, allowing compilation to macos, windows, and linux, using the zig compiler for cross-compilation. The entire set of compiled programs is less than 20MB.
Software
historical-permutations (2019)
javascript
github repository
npm package
A JavaScript library of historical permutation algorithms from 1956 to the present day.
I originally started collecting these algorithms together as I was doing some research on early permutation algorithms as part of an ongoing project about the "Permutation Poems" of the poet and artist Brion Gysin. However, I soon found that many of these algorithms were in hard-to-find papers and little documented, often because they were superceded by more efficient algorithms only years later.
I thought that this library might be of interest to those looking to learn about permutations or the history of early computing - especially those who are trying to find out more about the technology used to write early computational poetry. Due to the focus of my own research, nearly all of these algorithms are from the period 1956-65. I have tried to collect as many of the original papers as possible, and these now reside in the papers folder of this repository - this addition does make this repo very large, however, these pdfs are only included in the git repository, and not in the package available on npm.
Along with the algorithms themselves, now translated from ALGOL into JavaScript, there are a series of utilities, designed to make the use of the algorithms easier.
Pocknee-Gysin-Sommerville Algorithms
As part of my research, I wrote a collection of algorithms inspired by Brion Gysin and Ian Sommerville's pre-1965 Permutation Poems and other algorithms from this period.
I imagined algorithms that would have been possible using contemporaneous techniques found in other algorithms in this collection and the technical limitations of the period and that would create poems similar to Gysin's work.
The result is a collection of 4 algorithms that can each operate using two "rotation directions", affecting the way in which elements in an array are moved.
Algorithms
| date | name | type |
|---|---|---|
| 1400 | Pandita | lexicographic |
| 1956 | Tompkins-Paige | Tompkins-Paige |
| 1960 | Lehmer | Constant Difference Method |
| 1960 | Hall | Hall |
| 1961 | Coveyou-Sullivan (ACM71: PERMUTATION) | Coveyou-Sullivan |
| 1961 | Wells (ACM115) | Transposition Method |
| 1962 | Peck-Schrack (ACM86: PERMUTE) | Tompkins-Paige w/ leftwise rotation |
| 1962 | Schrack-Shimrat (ACM102: PERMULEX) | lexicographic |
| 1962/63 | Steinhaus-Trotter-Johnson (ACM115: PERM) | Steinhaus-Trotter-Johnson |
| 1962/63 | Steinhaus-Trotter-Johnson (ACM115: PERM) | Steinhaus-Trotter-Johnson (loopless) |
| 1962/63 | Steinhaus-Trotter-Johnson (ACM115: PERM) | Steinhaus-Trotter-Johnson (Even's speedup ) |
| 1963 | Heap | Heap |
| 1967 | Langdon | Langdon |
| 1968 | Ord-Smith (ACM323: BESTLEX) | reverse lexicographic |
| 2001 | Myrvold-Ruskey | remainder order |
| 2018 | Superpermutations | superpermutations |
| 2019 | Pocknee-Gysin-Sommerville | 8 different orderings |
"Every" Composition Tool (2018)
html, css, javascript, php, lilypond
react.js, webaudio
view the website
This is an app I created in 2018 to help me finish composing my guitar piece Every, which I started in 2013. Every is around 10 minutes in length and is "a compendium of almost every playable guitar chord of 1-6 notes solely containing the note E and consisting only of fingered pitches or natural harmonics (up to the 5th partial)".
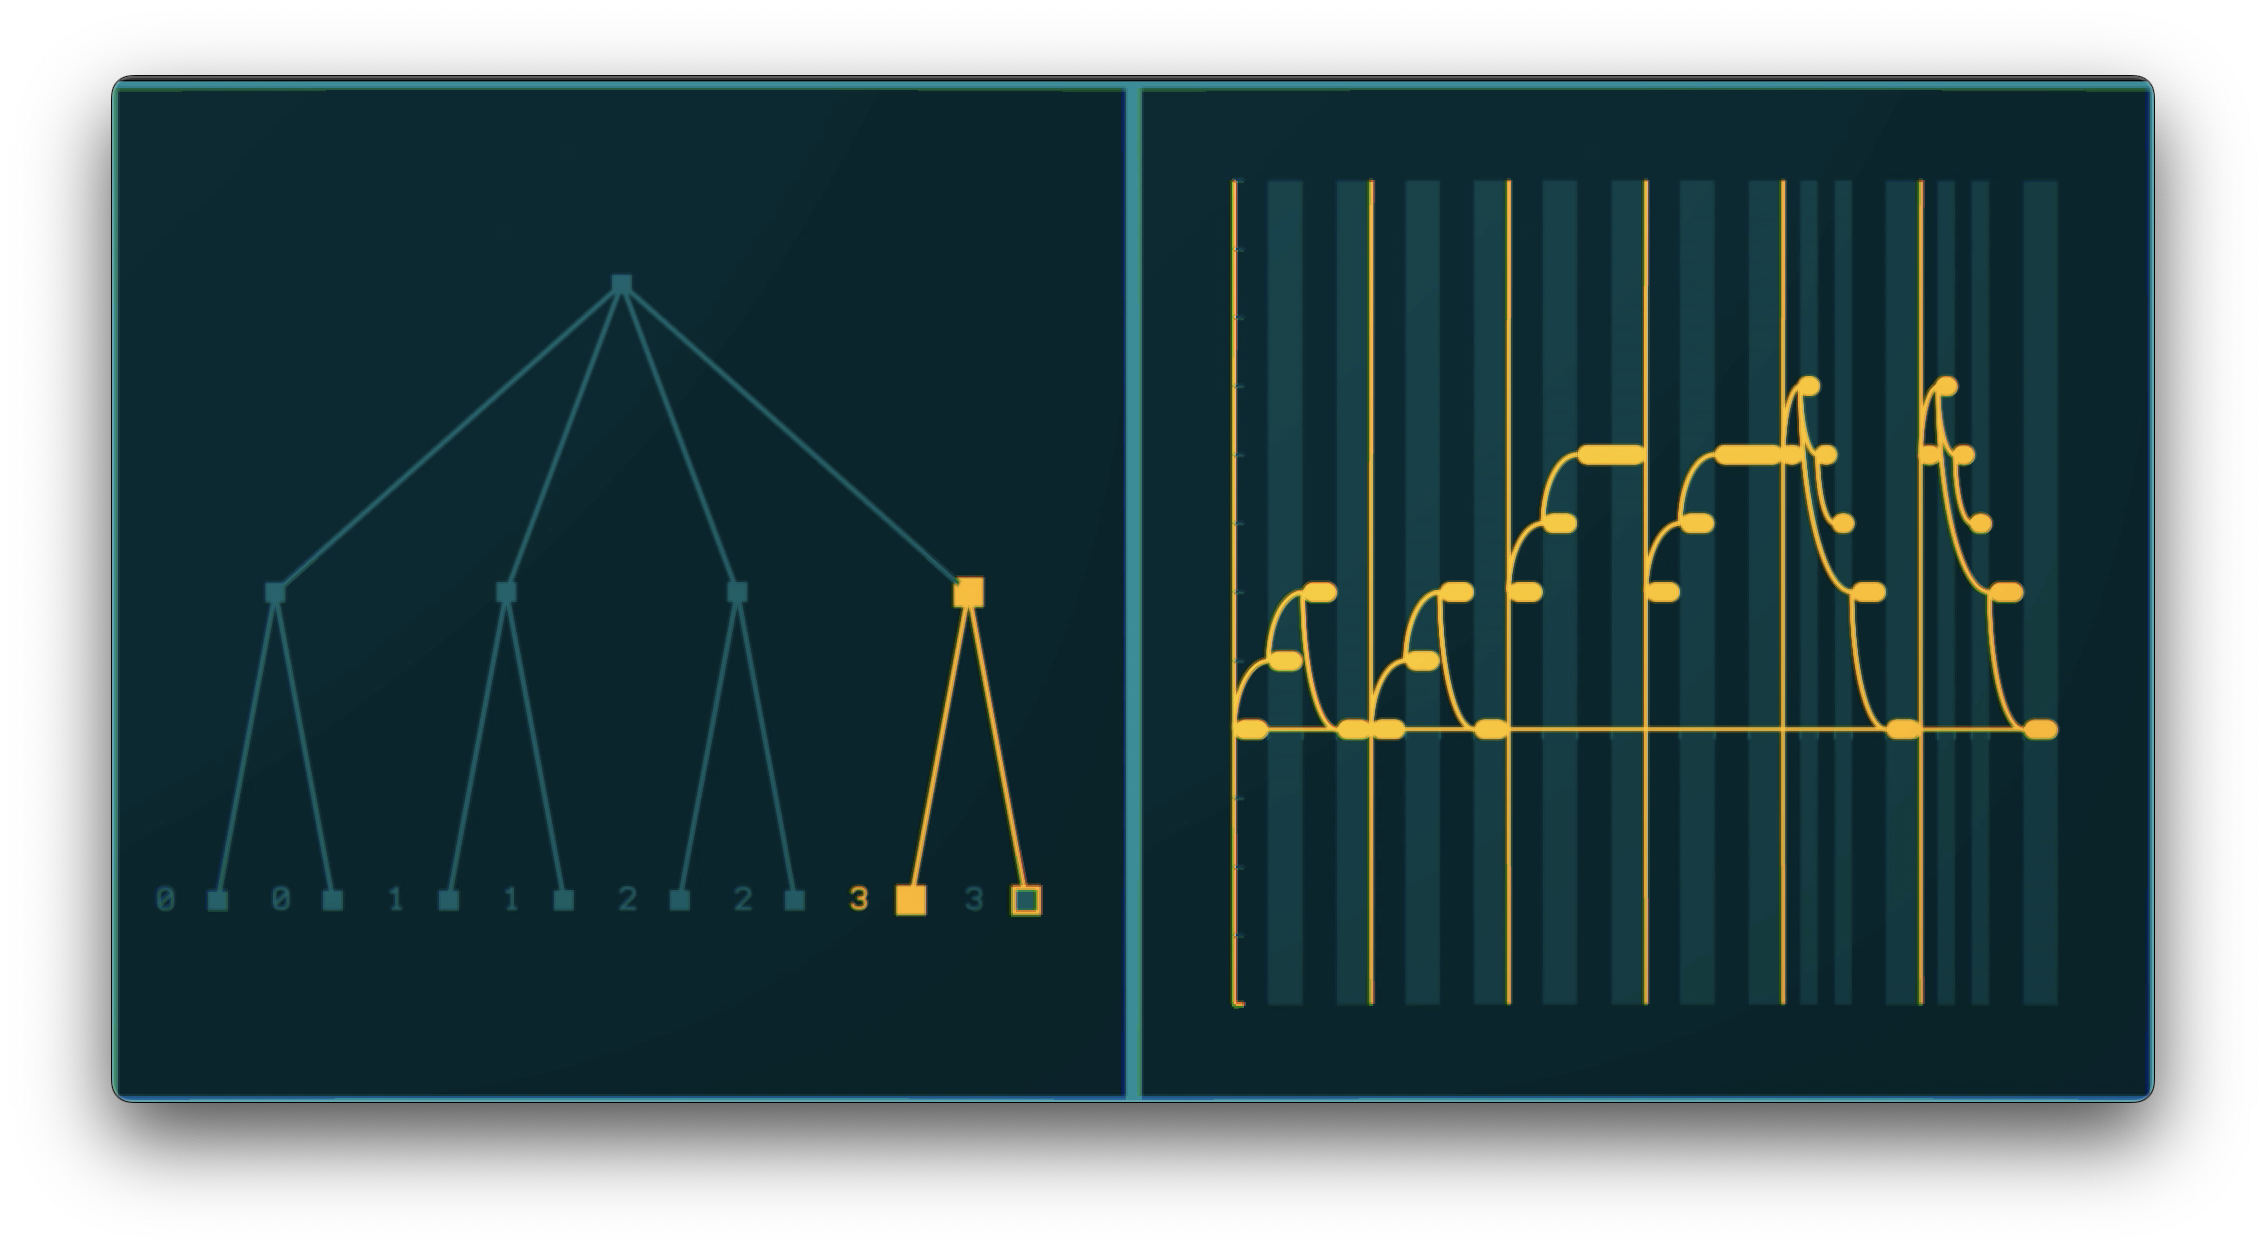
There are 319 possible chords that fit this criteria, and given the number of possible permutations, it became essential to build a tool that would allow an exploration of this combinatorial space in a way that was iterative and interactive, in order to ensure the output was playable and interesting to listen to. The rhythm of the piece is fixed - based on waves that gradually ebb in intensity - and so each ordering should attempt to find an ordering that suits this rhythm.
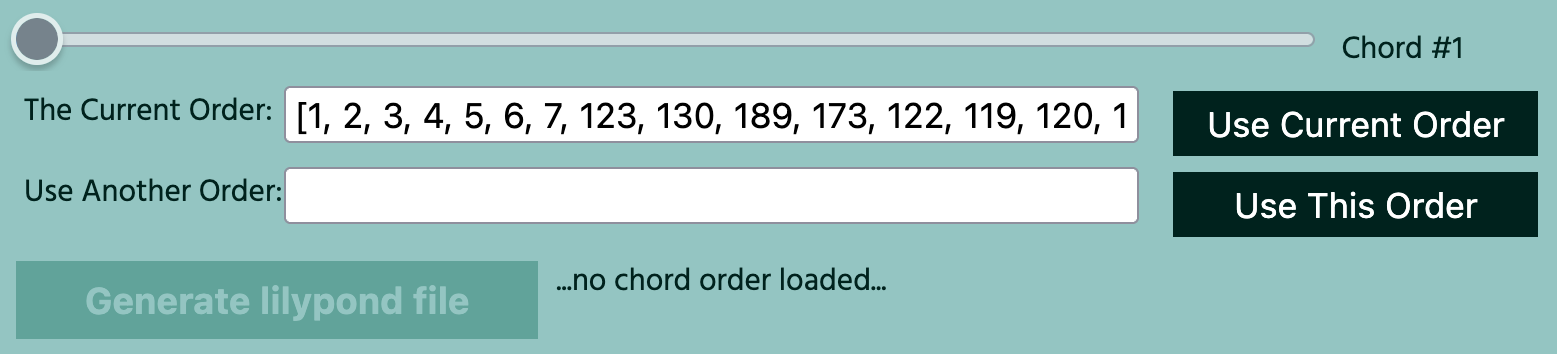
This interface shows all of the possible chords, and allows a user to drag and drop them into any order. A sythesized version of the re-ordered piece (algorithmically spliced together from samples) can then be played back by clicking the play and stop buttons in the bottom right of the window.
When the user has settled on an ordering they are happy with, they can export their result out as musical notation in lilypond code.
As well as being a tool for me, the composer, it could be used by guitar-players to create their own personalised version of the work, optimallly suited to their playing. When you open the website, the ordering given is my preferred ordering of the piece, however I like the idea of a performer making fine-tuning adjustments to the order of chords in the piece in order to aid playability, and personalize and shape the work according to the idiosyncracies of their playing and instrument.
Additionally, by making this code available online, I hope that it might be useful in helping other composers and performers to build similar interfaces for their musical projects.
Technical
This website is built using react.js, with the ReactJS DnD library handling the dragging-and-dropping. I thoroughly recommend their well-written tutorial.
Playback is handled using webaudio, which is playing back a set of pre-recorded guitar samples, that it combines and plays back to the user, when they click the playback button in the bottom right.
A `lilypond' musical notation file based on their chosen ordering of chords is generated for the user when they click the "Generate lilypond file" by sending a string containing an array of the numbers of the chords over to a php backend which dynamically builds and returns a lilypond file with the correct chords inserted.
This can then be compiled by the user with the lilypond app, to create the finished notation as a .pdf file.
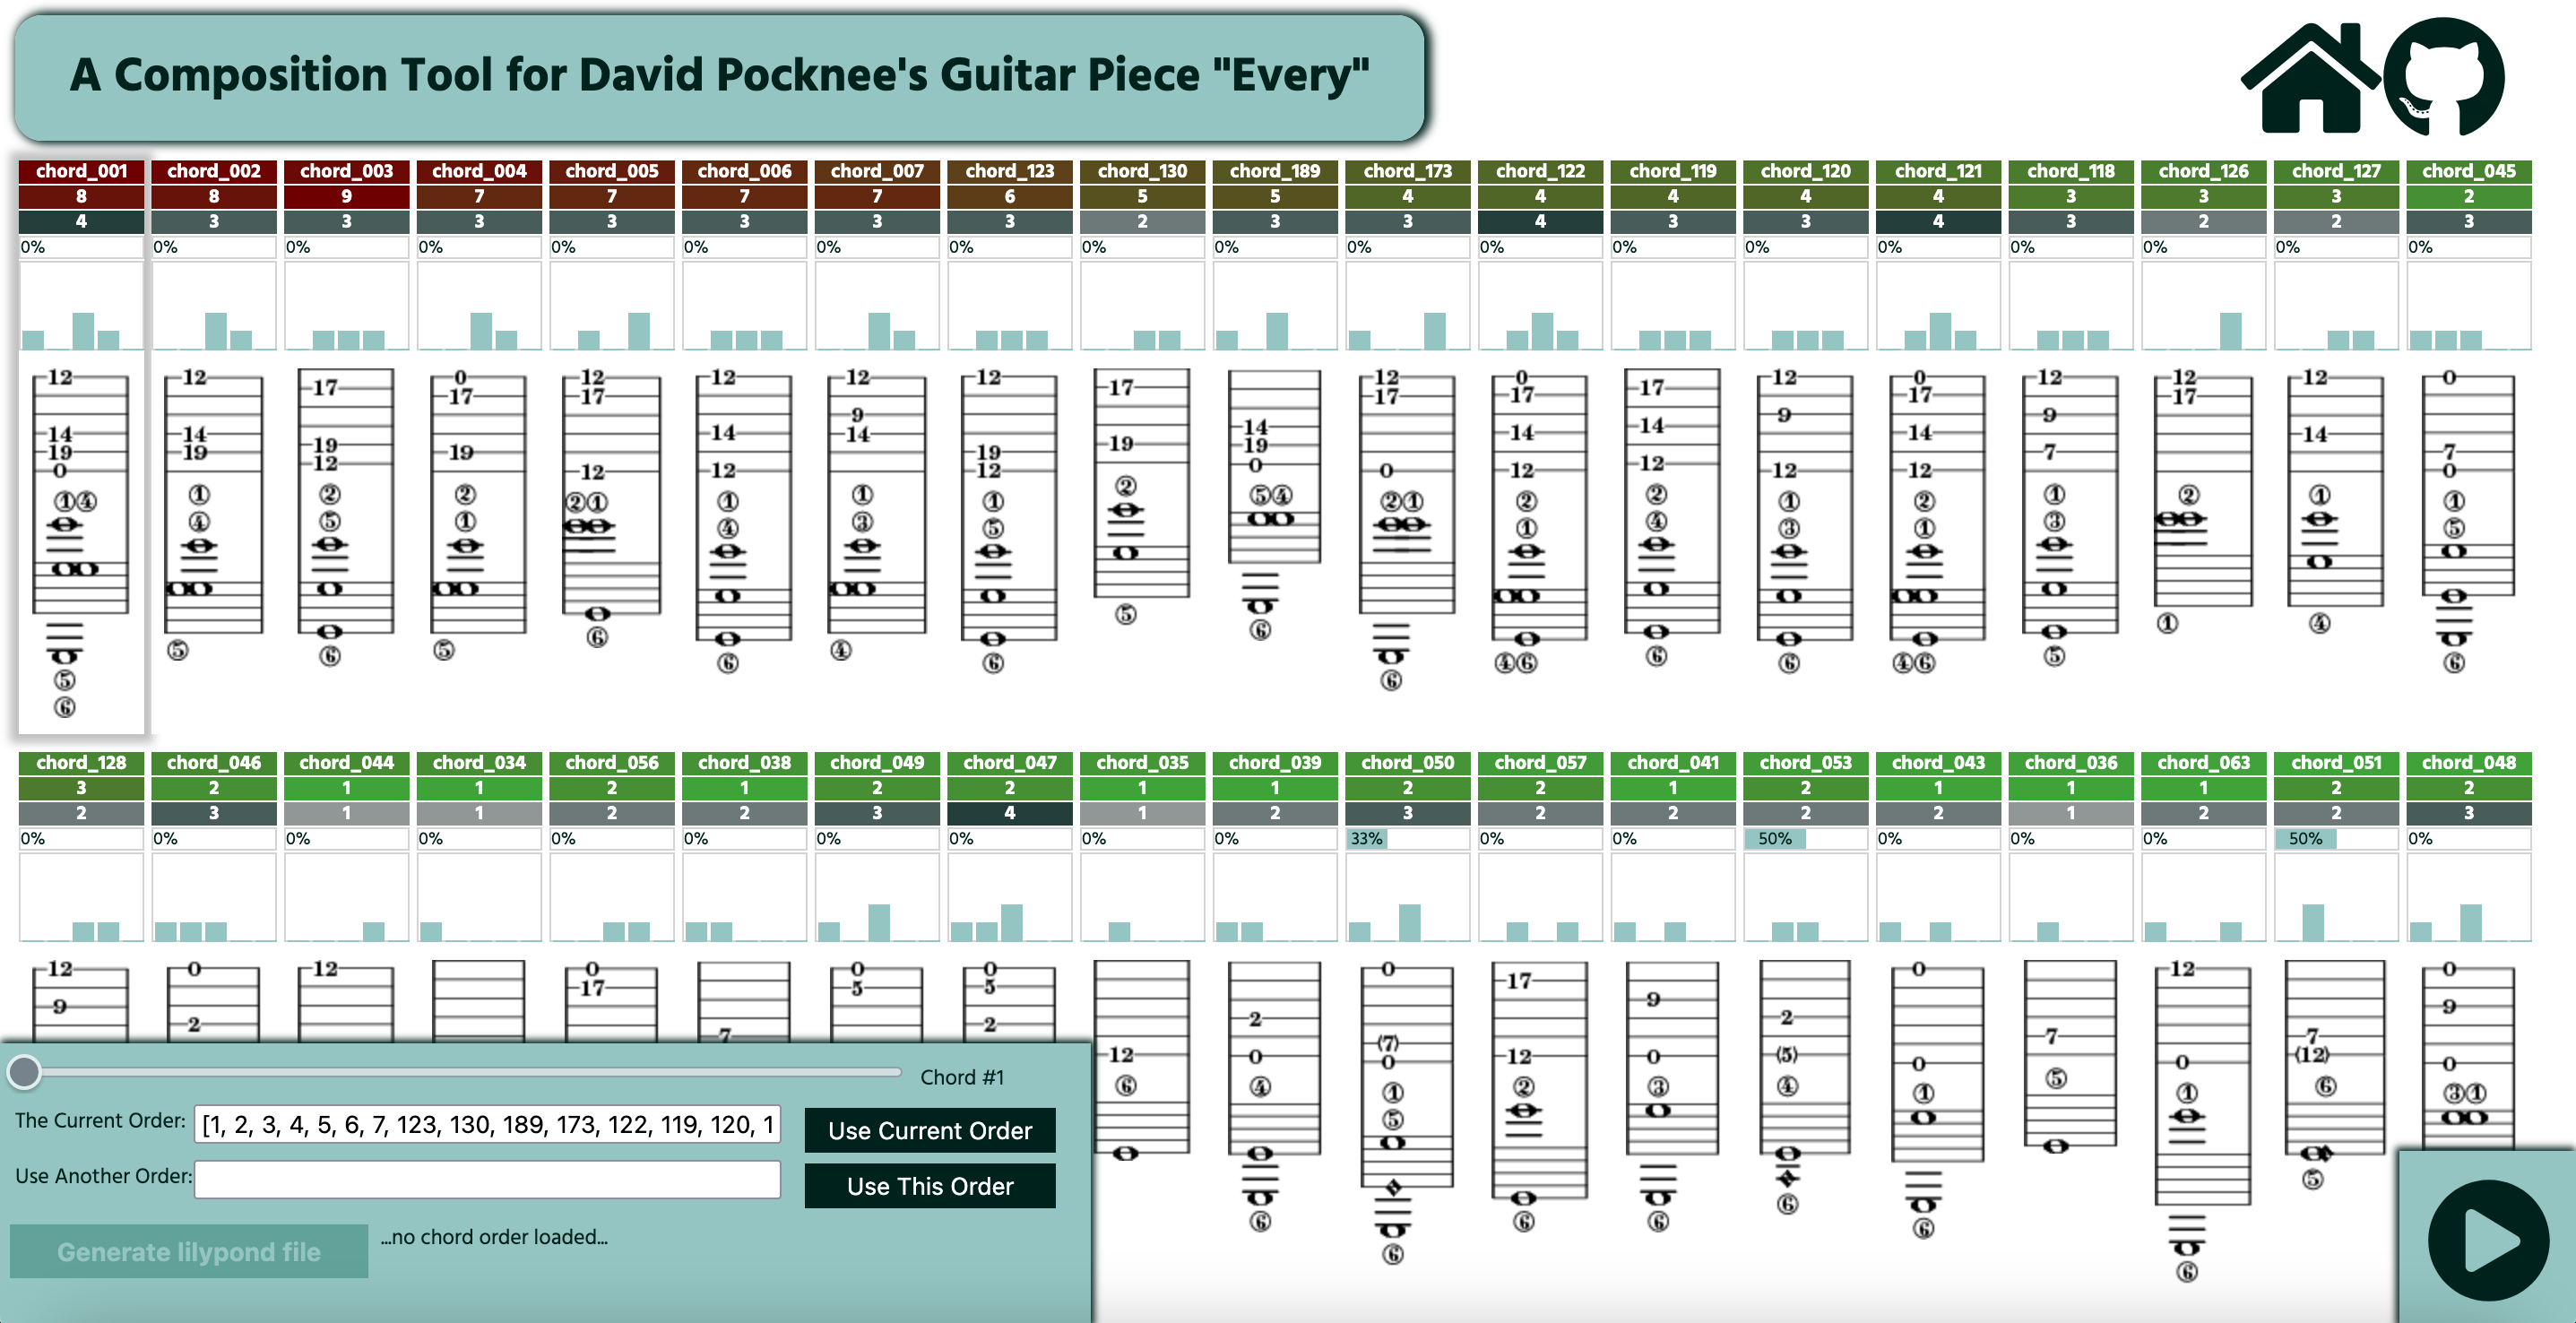
Using the website
The screen shows a grid of guitar chords, each with a set of metrics above them. A user can drag-and-drop any of the chords to any place in the grid, changing the order that chords will occur in the place.
Pressing the playback button in the bottom right of the screen will start a synthesized playback of the current order of piece, using the predetermined rhythm of the work. The slider in the bottom left of the window can be used to choose the chord from which this playback starts (indicated by a shadow).
Below the slider, is a text box with the label "The Current Order". The contents of this box represents the current ordering of chords as an array of numbers. This array can be copied by the user and loaded back into the program by pasting it into the box below (labeled "Use Another Order") and clicking the "Use This Order" button.
If a user is happy with the order to be taken to a new window containing the code for a lilypond file of the notation of their version of the guitar piece.
The chords
Each chord is written in tablature and standard notation, and has a set of statistics above it, which should help aid finding an ideal place for it in the piece:

- A chord reference number (e.g. chord_123).
- How difficult the chord is to play.
- The number of notes in the chord.
- The percentage of notes in the chord that are harmonics.
- A histogram showing how the sounding pitches in each chord are distributed over the five possible octaves.
The background color of the chord reference number and the chord difficulty, vary between green and red. The former is color-coded according to the duration before the next chord (long = green, short = red), based on the rhythm of the piece. The latter uses a scale from 1-9, in which 1 = easy/green and 9 = very difficult/red. The use of these two metrics should help ensure that difficult chords can be located in places in the piece in which there is adequate time to prepare and execute them. The number of notes in the chord is als color-coded - the more notes, the darker the color.
You can see the name of each statistic by hovering your mouse over it.
Dodecafinder (2017)
ruby
Standalone software, written in ruby, that uses a genetic algorithm to find twelve-tone rows with specific characteristics
About twelve-tone rows
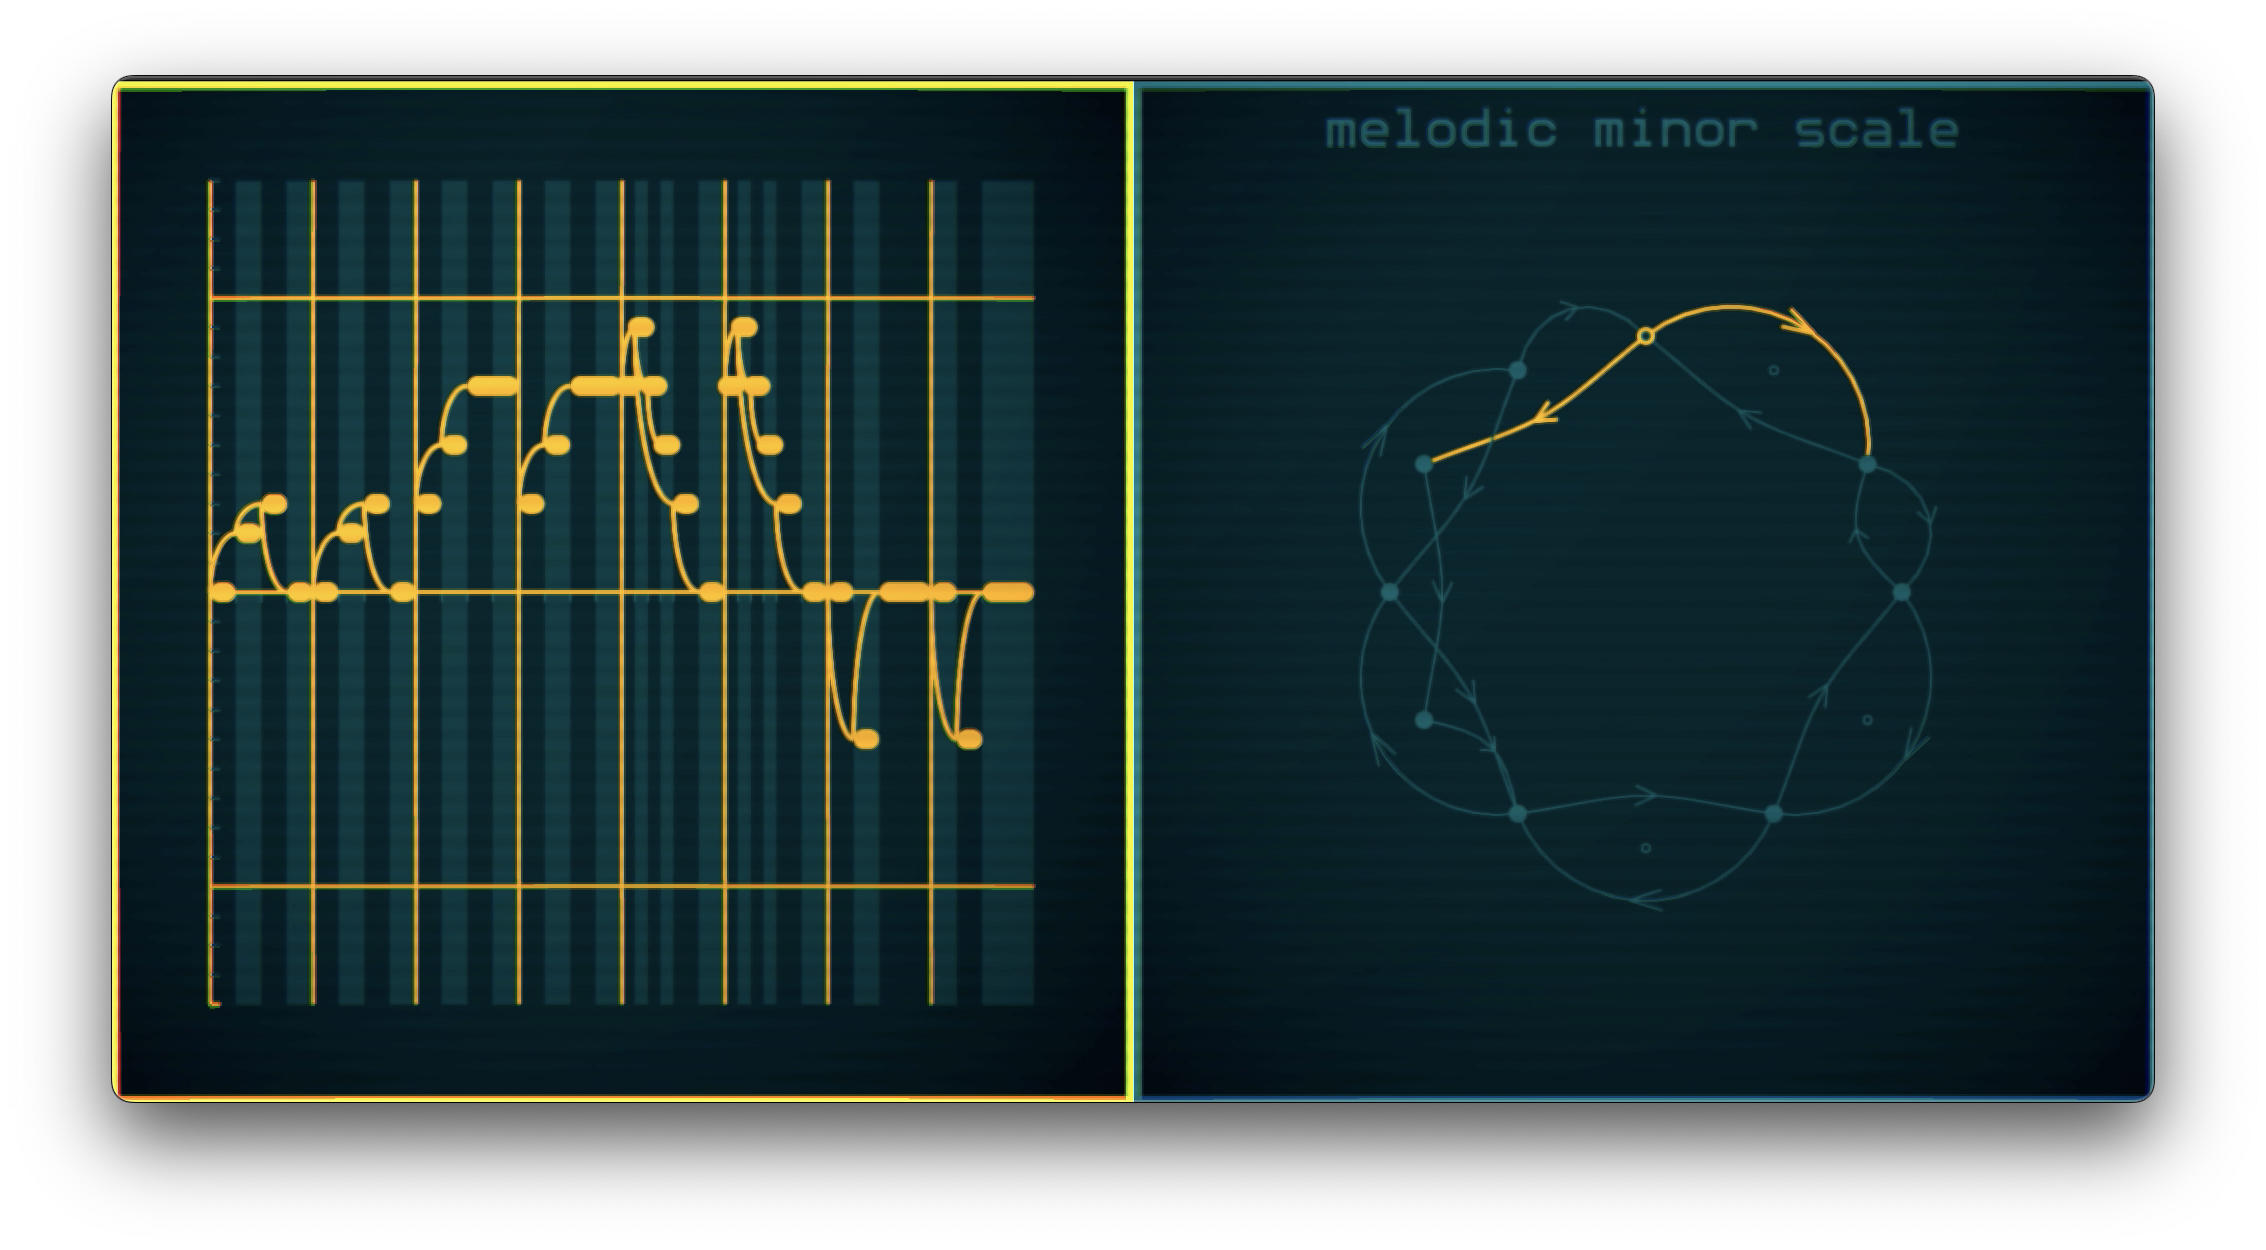
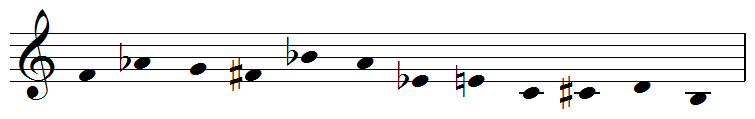
Twelve-tone composition was a way of composing music that emerged in Austria and Germany at the beginning of the Twentieth Century. The heart of this music was a set of techniques based around the idea of a twelve-tone row. A twelve-tone row is simply a series containing all 12 pitches within an octave, arranged such that each one occurs only once. For instance, here is a twelve-tone row used in the composer Anton Webern's Symphony (1928), notice how each pitch occurs only once:
There are 479 million possible 12-tone rows (12! = 479,001,600). This makes doing a brute-force search for a row with specific characteristics time-consuming and computationally expensive. Dodecafinder uses a genetic algorithmic approach to reduce the time and computation needed to find rows which optimally match a given set of characteristics.
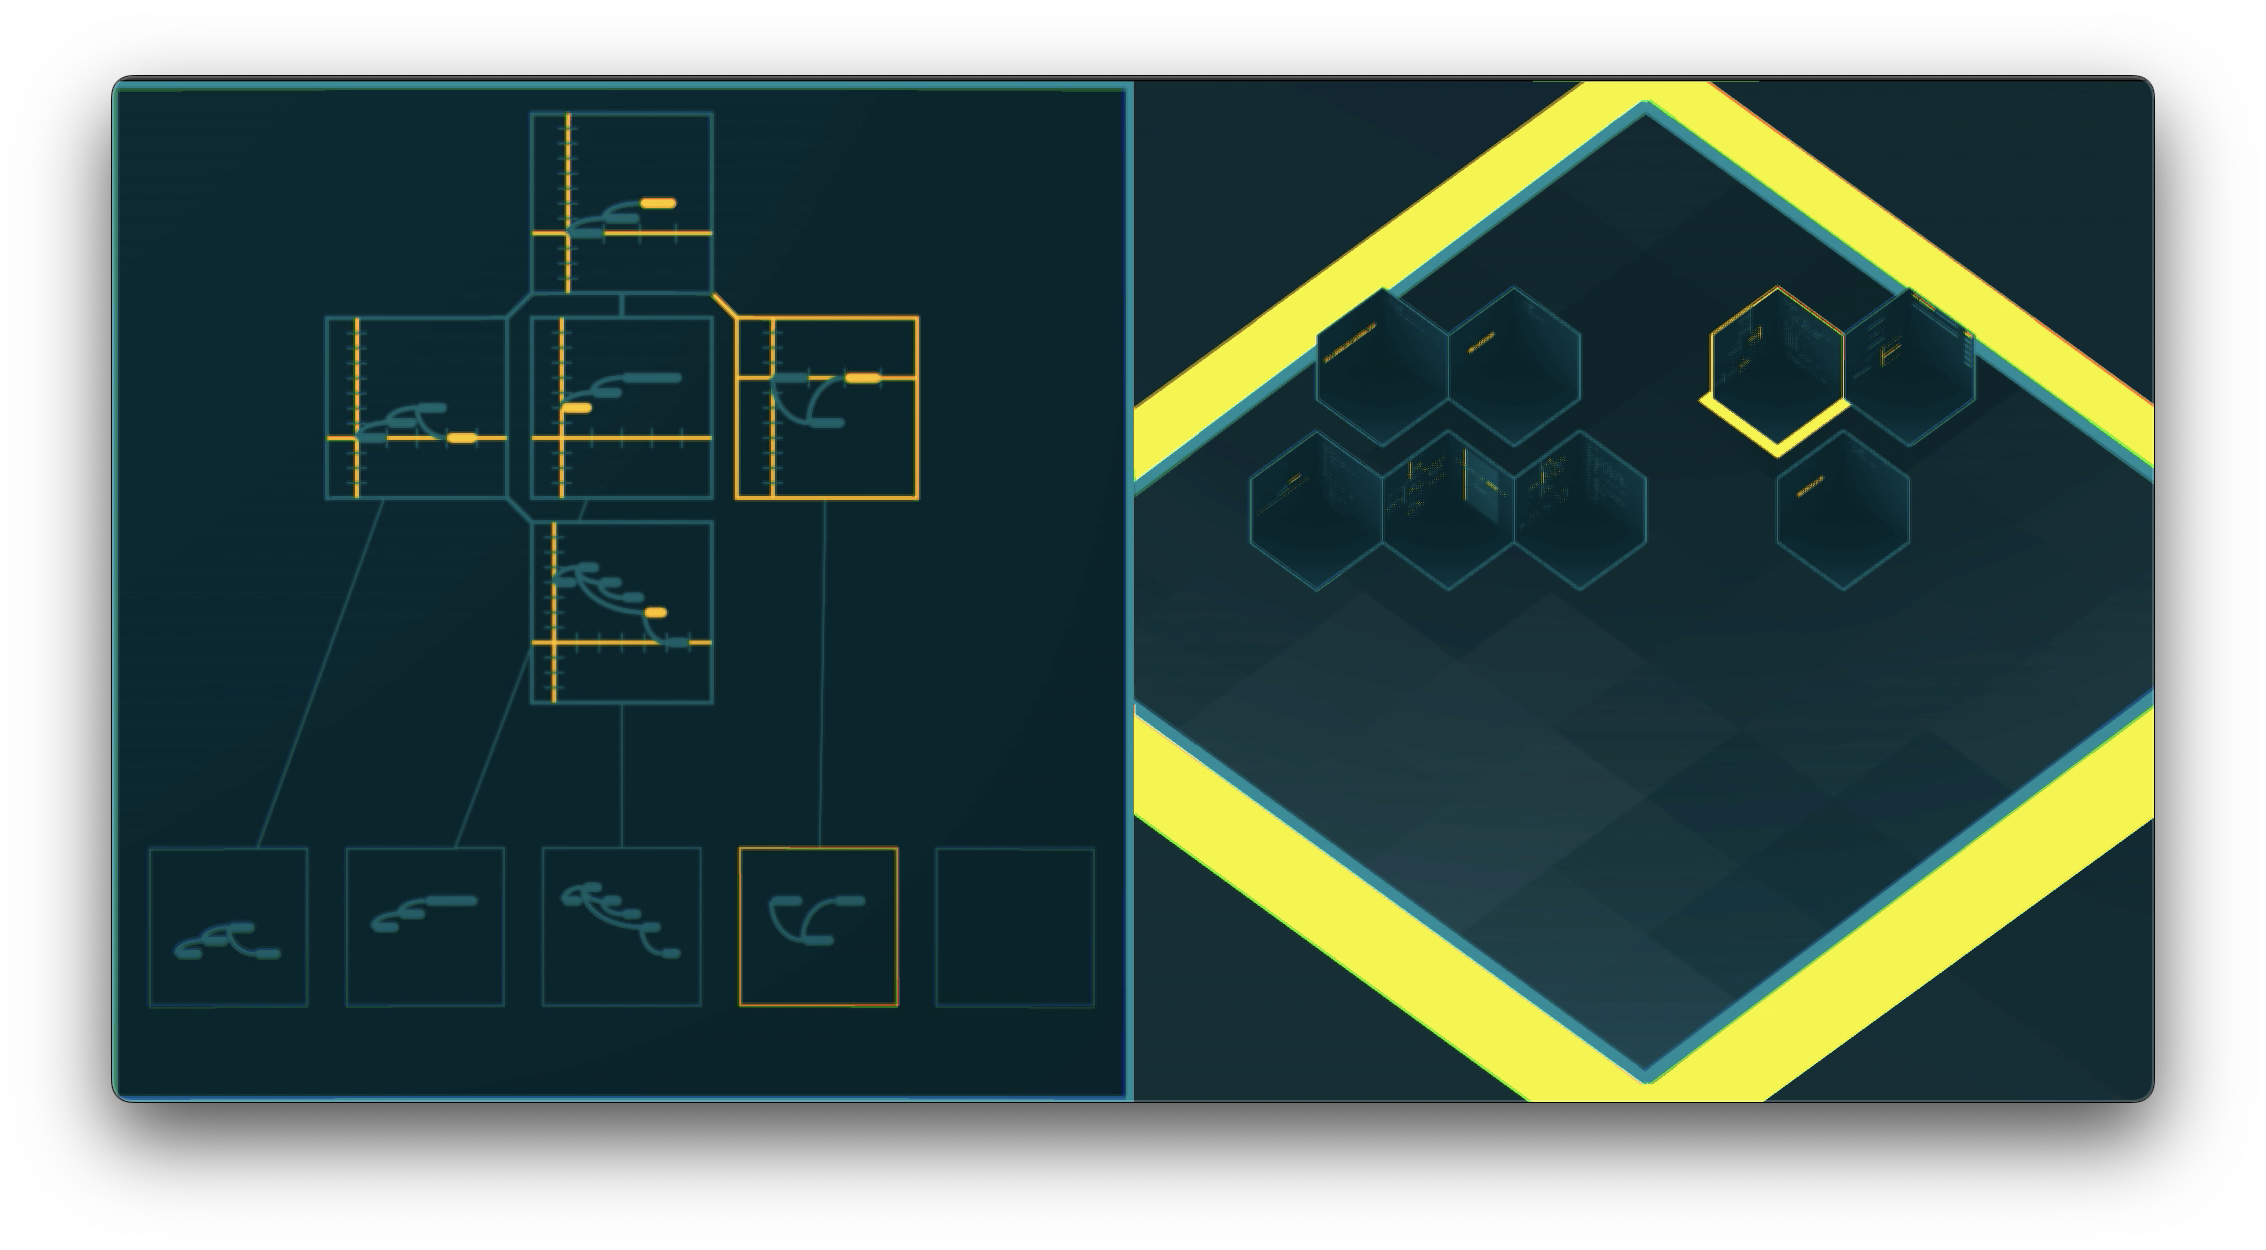
Dodecafinder: How it works
Imagine you want to find 12-tone row with only retrograde symmetries involving 3,4 and 9 notes, that moves in an upwards direction but which has minimal intervallic repetition. Dodecafinder can find a row which optimally matches this criteria in a matter of seconds.
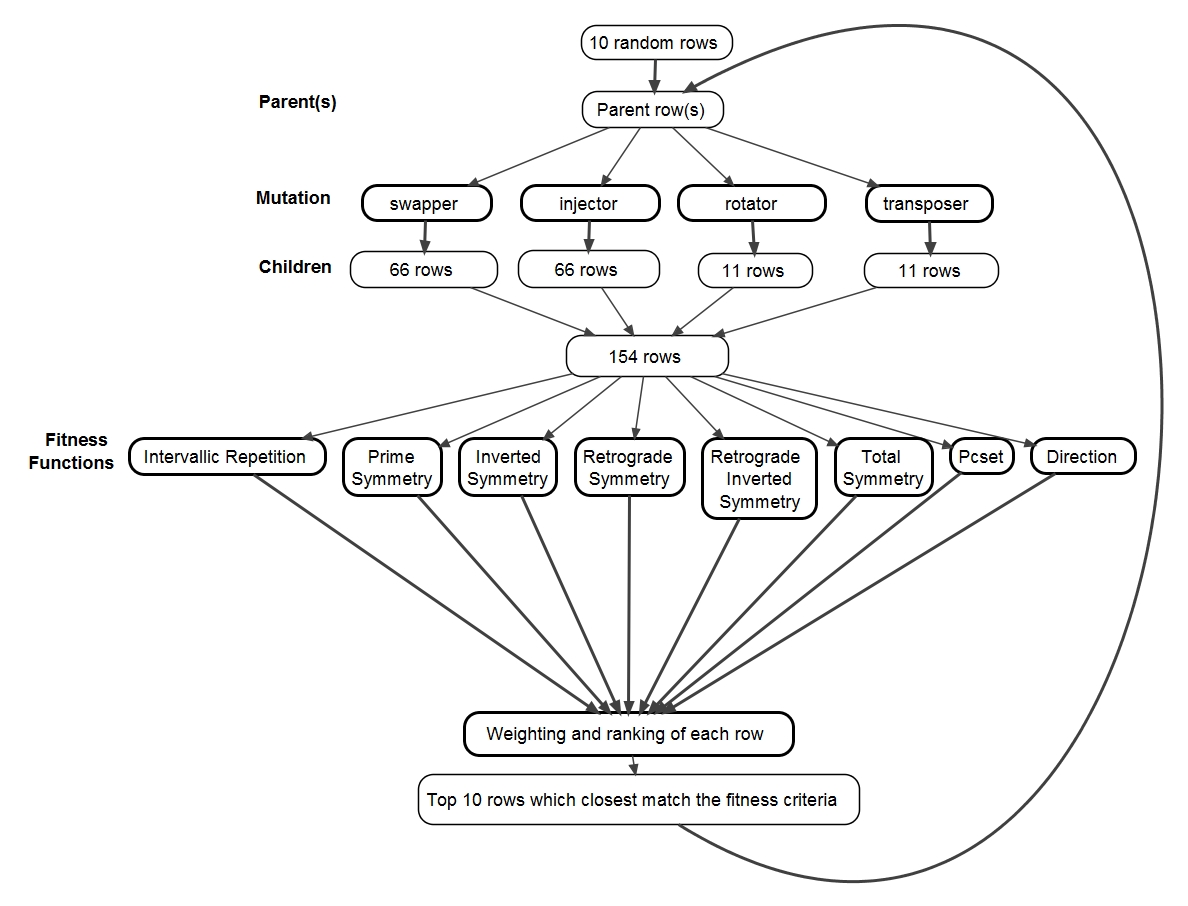
Dodecafinder works by generating a set of random rows (parents), which are then "mutated" to create related rows. These "mutations" involve note-swapping, shifting of notes, rotation and transposition. The mutated rows and the original rows are then evaluated as to how closely they fit the target criteria for a row, and the top-scoring rows are then carried forward to become the “parents” for the next generation, which are then mutated. At the end of multiple iterations of this processes, the “survival of the fittest” set-up of the algorithm results in a row which is optimally suited to the starting criteria.
The diagram below shows this process in action, starting with a set of 10 random parents, and carrying over 10 rows between each generation. Notice how each row only generates 154 mutated child rows, this means that, given a set of 10 parent rows and 12 generations, the computer only has to evaluate 154x10x12 = 18,480 rows, as opposed to 479 million - a reduction by a factor of 25,920.
Installing dodecafinder
Dodecafinder is coded in ruby and can be downloaded as either a standalone, windows .exe file, or as ruby source code. If running the program as ruby code, you will need the gem fxruby installed for the gui to work (if ruby is already installed, fxruby can be installed by typing gem install fxruby in the terminal/command prompt etc.).
General Use Of The Program
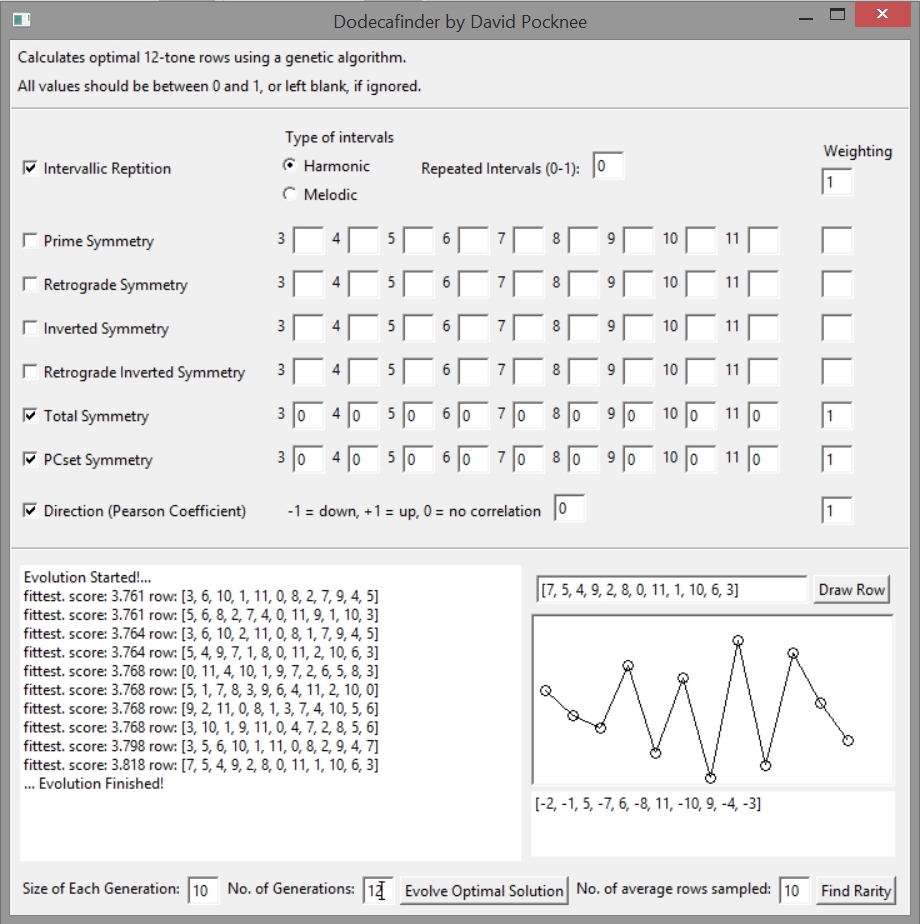
To generate a row which optimally fits a particular set of criteria, tick the check box to the left of the name of the criteria you wish to use. You must then also fill in a weighting on the far right of the interface. This specifies how much importance this particular category should have when evaluating each row. It should be a number between 0 and 1.
All boxes in the top half of the software interface take a number between 0 and 1, this can be a float. Leaving a box blank means that it will not be taken into account when assessing rows. If you are using a particular criteria, the weighting box for this criteria must always be filled. For the numbered symmetry boxes, placing a 0 in the box indicates that the software will search for rows in which that symmetry does not occur, whereas putting a 1 in the box will cause a search for rows with a high prevalence of that type of symmetry.
Once you are happy with the criteria you want to use and have chosen your preferred variables, you must fill the boxes titled “Size of each generation” and “No. of generations” at the bottom left of the interface.
“Size of each generation” is the number of random starting parents as well as the number of rows carried over between each generation. The default here is 10, but if the algorithm is giving poor results, I recommend increasing this.
“No. of generations” is the amount of generations the algorithm cycles through before stopping. I recommend increasing this if you are increasing the size of each generation. The default is 12.
Once these variables are specified you can then click “Evolve Optimal Solution”. The algorithm will then run, and the current process can be seen in the command prompt window which will open along with the main GUI. In this window, the current generation and its “fittest” mutations are shown. This output may be useful for debugging. The output shows:
[overall score [array of scores for each individual criteria selected] original row]
A higher score indicates a closer match to the criteria selected.
Once the algorithm has finished, the fittest mutations of the final generation are shown in the window in the left of the main interface. This output shows whether the row was a SOLUTION, meaning it exactly meets all the criteria you laid down, or is simply “fittest”, meaning it is one of the fittest of that generation but is not an exact match for the criteria given. The output also shows the score the row was given, in relation to the criteria you specified, and the actual row as an array of numbers between 0 and 11.
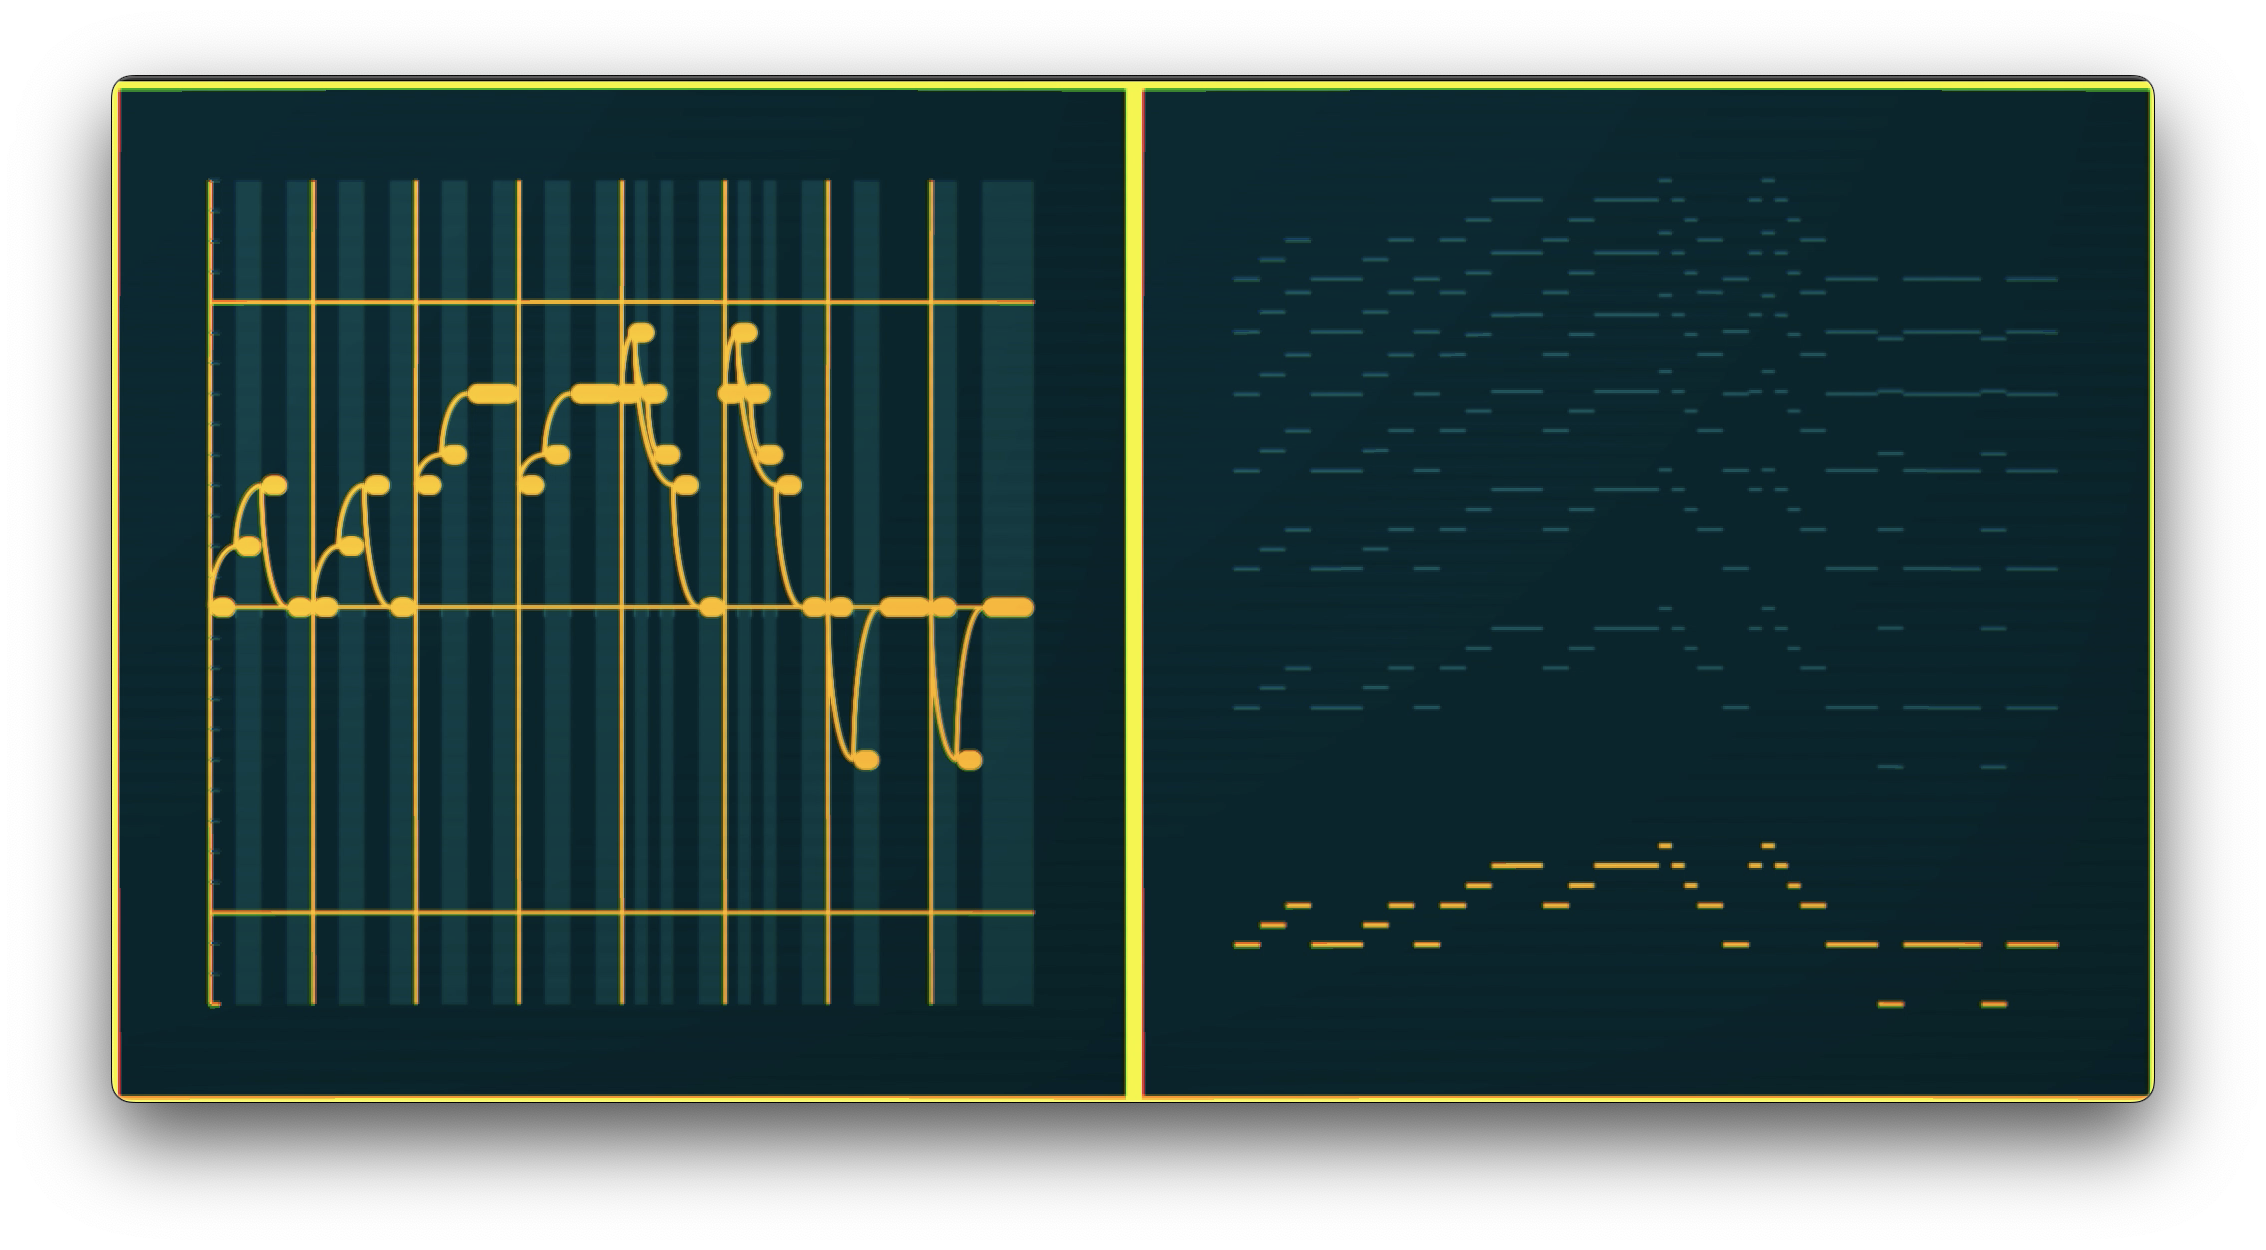
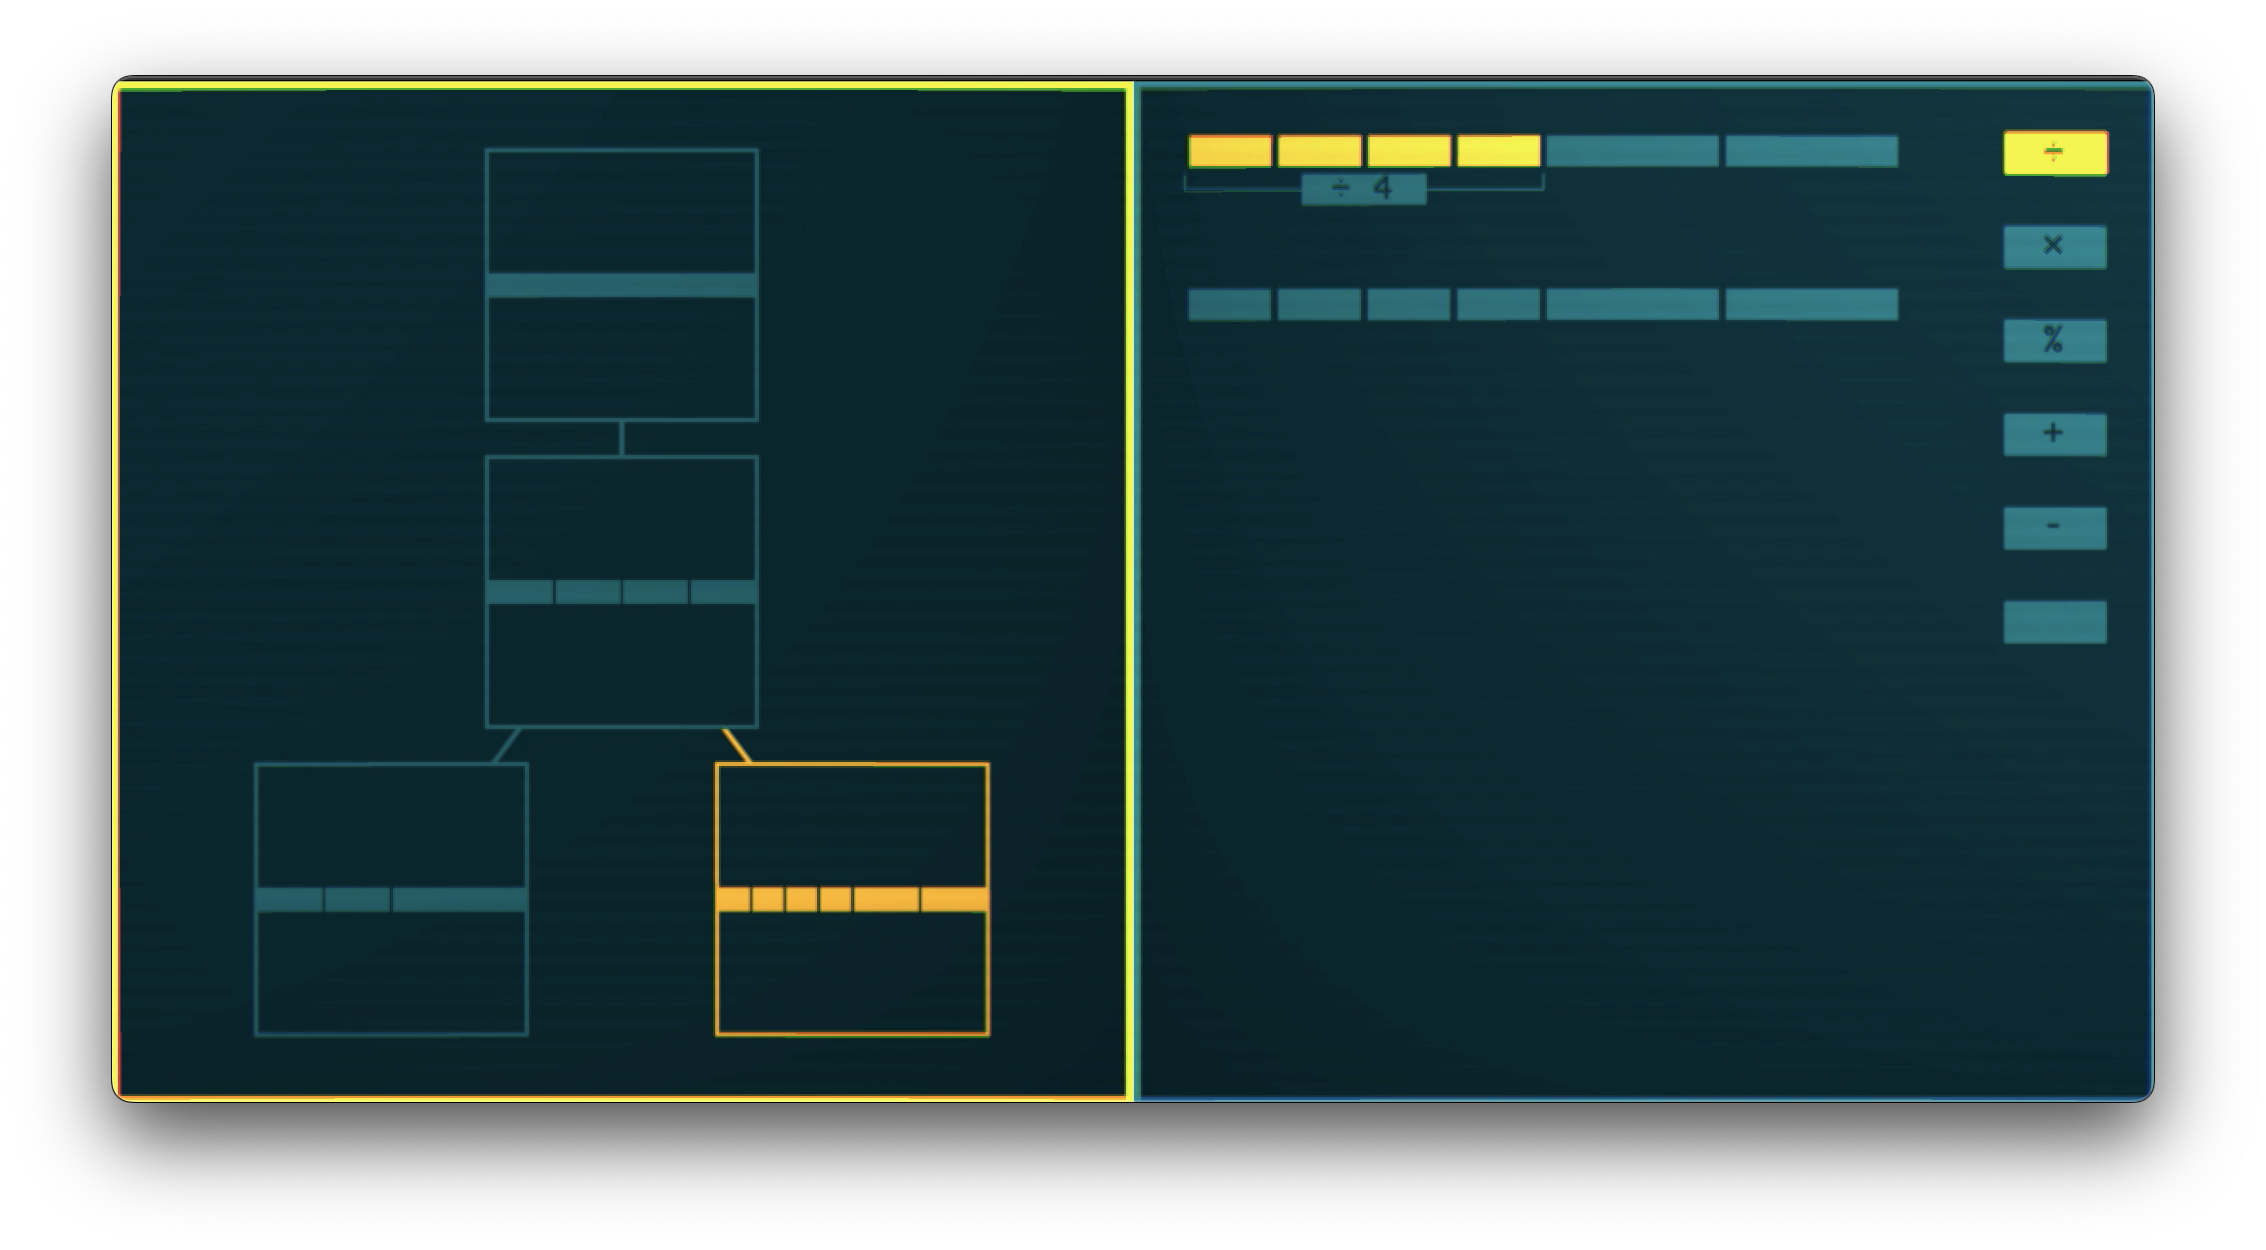
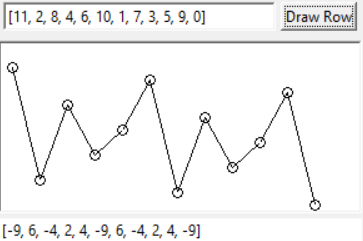
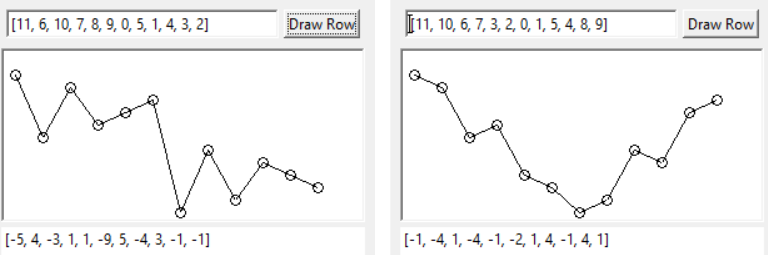
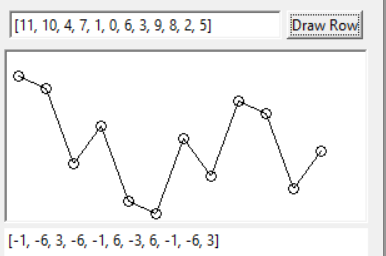
This array can then be copied over to the box on the right of the interface next to the “Draw Row” button. When that box is filled with an array of a 12-tone row (scaled between 0 and 11) and the button is clicked, it produces a visual representation of the row, along with the vectors of the row underneath.
Find Rarity
This button, in the bottom right corner is an experimental algorithm for finding “interesting” rows by looking for rarity in the combinatorial space. The algorithm randomly samples from all possible twelve tone rows, analyses them using any criteria selected in the top of the interface, averages these values, and then tries to evolve a row which is as far away from the average of the combinatorial space as possible. I suggest setting the “No. of average rows sampled” variable relatively high for maximum success (+ 100).
Using dodecafinder
Dodecafinder checks rows according to 8 criteria:
1. Intervallic Repetition
This is the number of times an interval between two consecutive notes is repeated over the course of the row. A row such as:

would have an intervallic repetition rating of 0, as all the notes here are a semitone apart, but a row such as:

would have an intervallic repetition rating of 1, as all of the intervals are different.
The intervals in a row can be represented as an array of vectors. For instance, the intervals of the first of the rows above can be represented as:
[1, 1, 1, 1, 1, 1, 1, 1, 1, 1, 1]
and the second of the rows above can be represented as:
[-1, -2, 5, -7, 6, -8, 11, -10, 9, -4, -3]
There are two types of intervallic repetition in dodecafinder: harmonic and melodic. In the harmonic setting, each interval is counted irrespective of the direction it moves in – so a minor 3rd up is seen as the same as a minor 3rd down (e.g +3 = -3). In the melodic setting a minor 3rd down would be seen as different to a minor 3rd up e.g. ( +3 ≠ -3).
The Repeated Intervals box in the software should be filled with a number between 0 and 1; 0 meaning that the row should consist solely of repeated intervals, 1 meaning that there should be no repeated intervals.
2. Prime Symmetry
This would normally be referred to as "motivic repetition". In other words, it is a measure of how many times a set of intervals is repeated. Each of the numbered boxes in the software are used to specify the length of this motif, for instance, by typing a 1 in the “3” box, the software will try to find rows which have a large amount of motifs with a length of 3. Consider the example above, which has a high degree of prime symmetry around 3 and 4.
3. Retrograde Symmetry
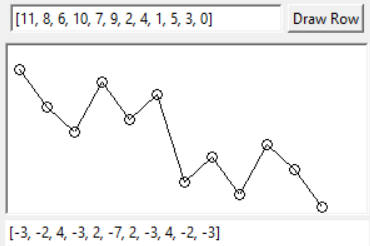
This uses a similar system to prime symmetry but instead tries to find rows in which the motif is retrograded. Above is an example of a row with a high degree of retrograde symmetry.
4. / 5. Inverted Symmetry / Retrograde Inverted Symmetry
These are the logical extension of the types of symmetry seen above. An example of a row with a high level of inverted symmetry, and row with a high level of retrograde symmetry can be seen above.
6. Total Symmetry
If you are interested in rows which simply have high levels of symmetry, irrespective of whether they are prime, retrograde, inverted etc. then the Total Symmetry option is recommended. In any row, one type of symmetry will prevent another type from occurring, so Total Symmetry is designed to be used when a mix of symmetry types are being looked for but these do not need to be specified. See this option as the OR as opposed to the AND created by combining the different types of symmetry manually. An example of a row with a high level of total symmetry can be seen on the left.
7. PCset Symmetry
This functions in a similar way to the symmetry variables above but instead it looks for repeated pitch class sets in the row. 1 = high level of repeated pcsets, 0 = no repeated pcsets. Similarly, the size of pcset used can be specified.
8. Direction
This allows you to specify the direction and/or amount of correlation in a row. 0 = no overall direction in the row, +1 = the row goes upwards, -1 = the row goes downwards. This is calculated using the Pearson Correlation Coefficient.